

Question: solve this 3. (5 points) The following table shows the stock prices of Google from 2/7/2005 to 2/18/2005: date price 2/7/2005 196.03 2/8/2005 198.64 2/9/2005
solve this
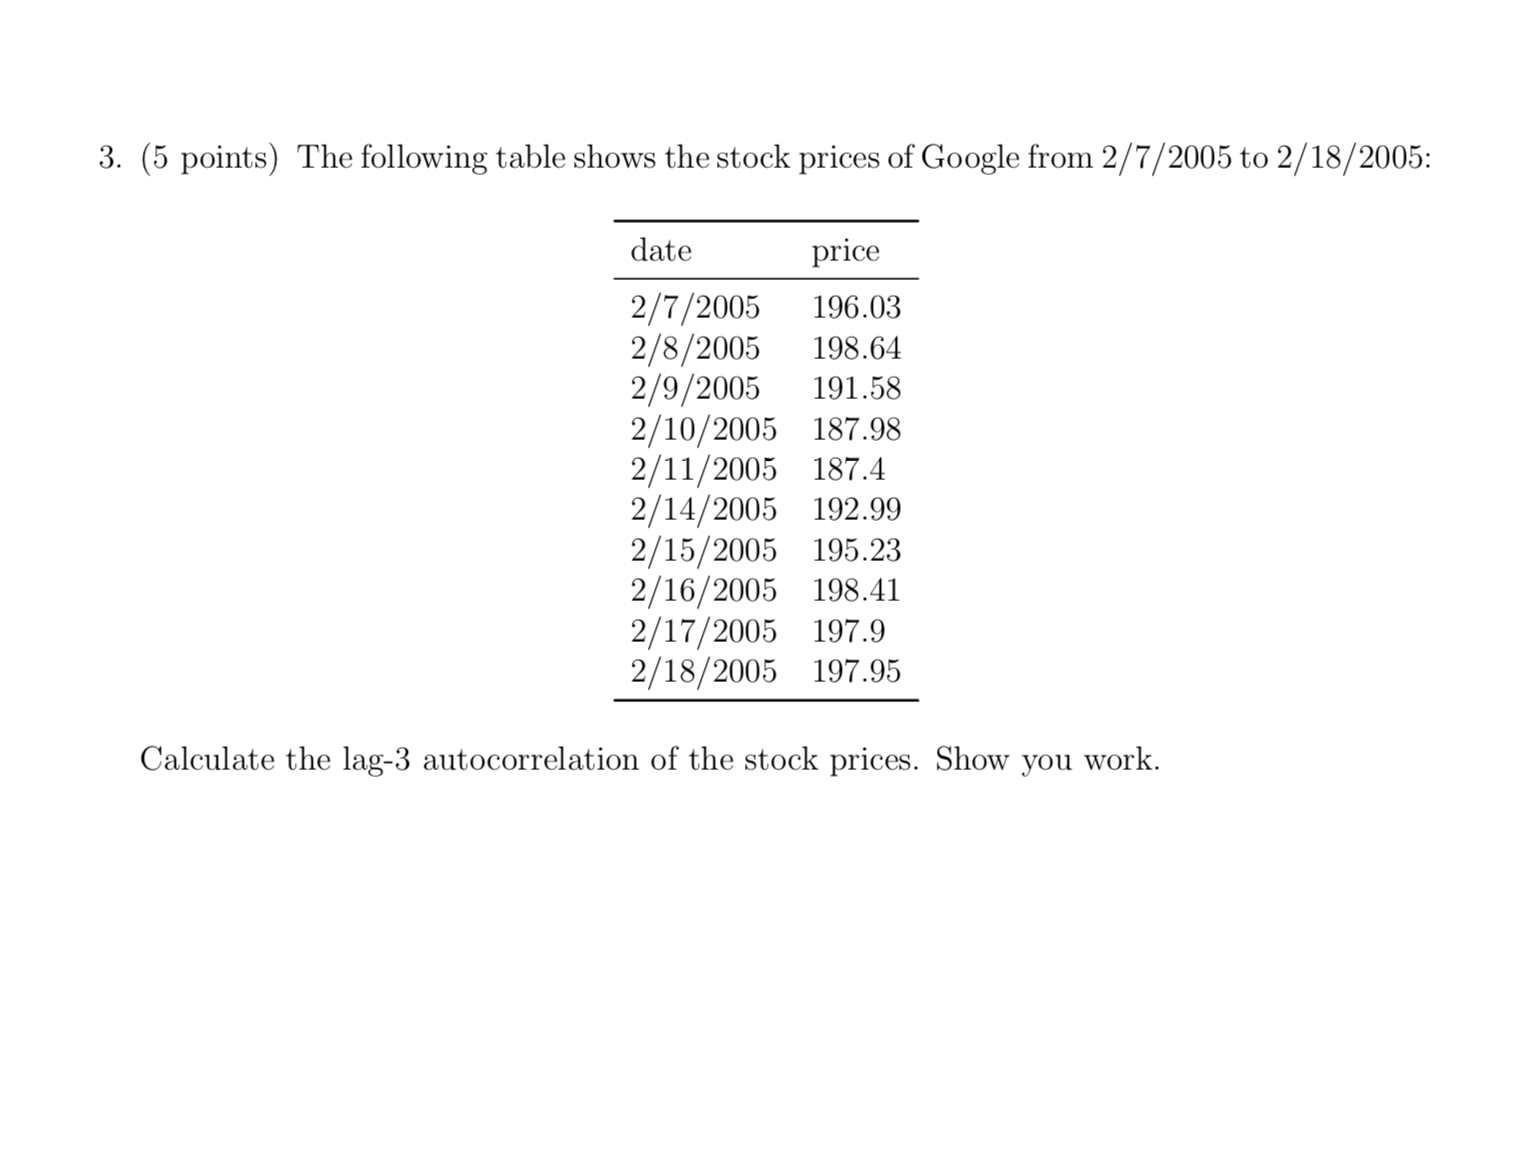
3. (5 points) The following table shows the stock prices of Google from 2/7/2005 to 2/18/2005: date price 2/7/2005 196.03 2/8/2005 198.64 2/9/2005 191.58 2/10/2005 187.98 2/11/2005 187.4 2/14/2005 192.99 2/15/2005 195.23 2/16/2005 198.41 2/17/2005 197.9 2/18/2005 197.95 Calculate the lag-3 autocorrelation of the stock prices. Show you work
Step by Step Solution
There are 3 Steps involved in it
1 Expert Approved Answer
Step: 1 Unlock

Question Has Been Solved by an Expert!
Get step-by-step solutions from verified subject matter experts
Step: 2 Unlock
Step: 3 Unlock