

Question: solve this problem CANNA, Inc. Comparative Balance Sheet December 31, 2022 and 2021 # 2022 2021 $173,700 204,500 130,500 $508,700 $167,000 182,000 97,000 $446,000 Assets
solve this problem
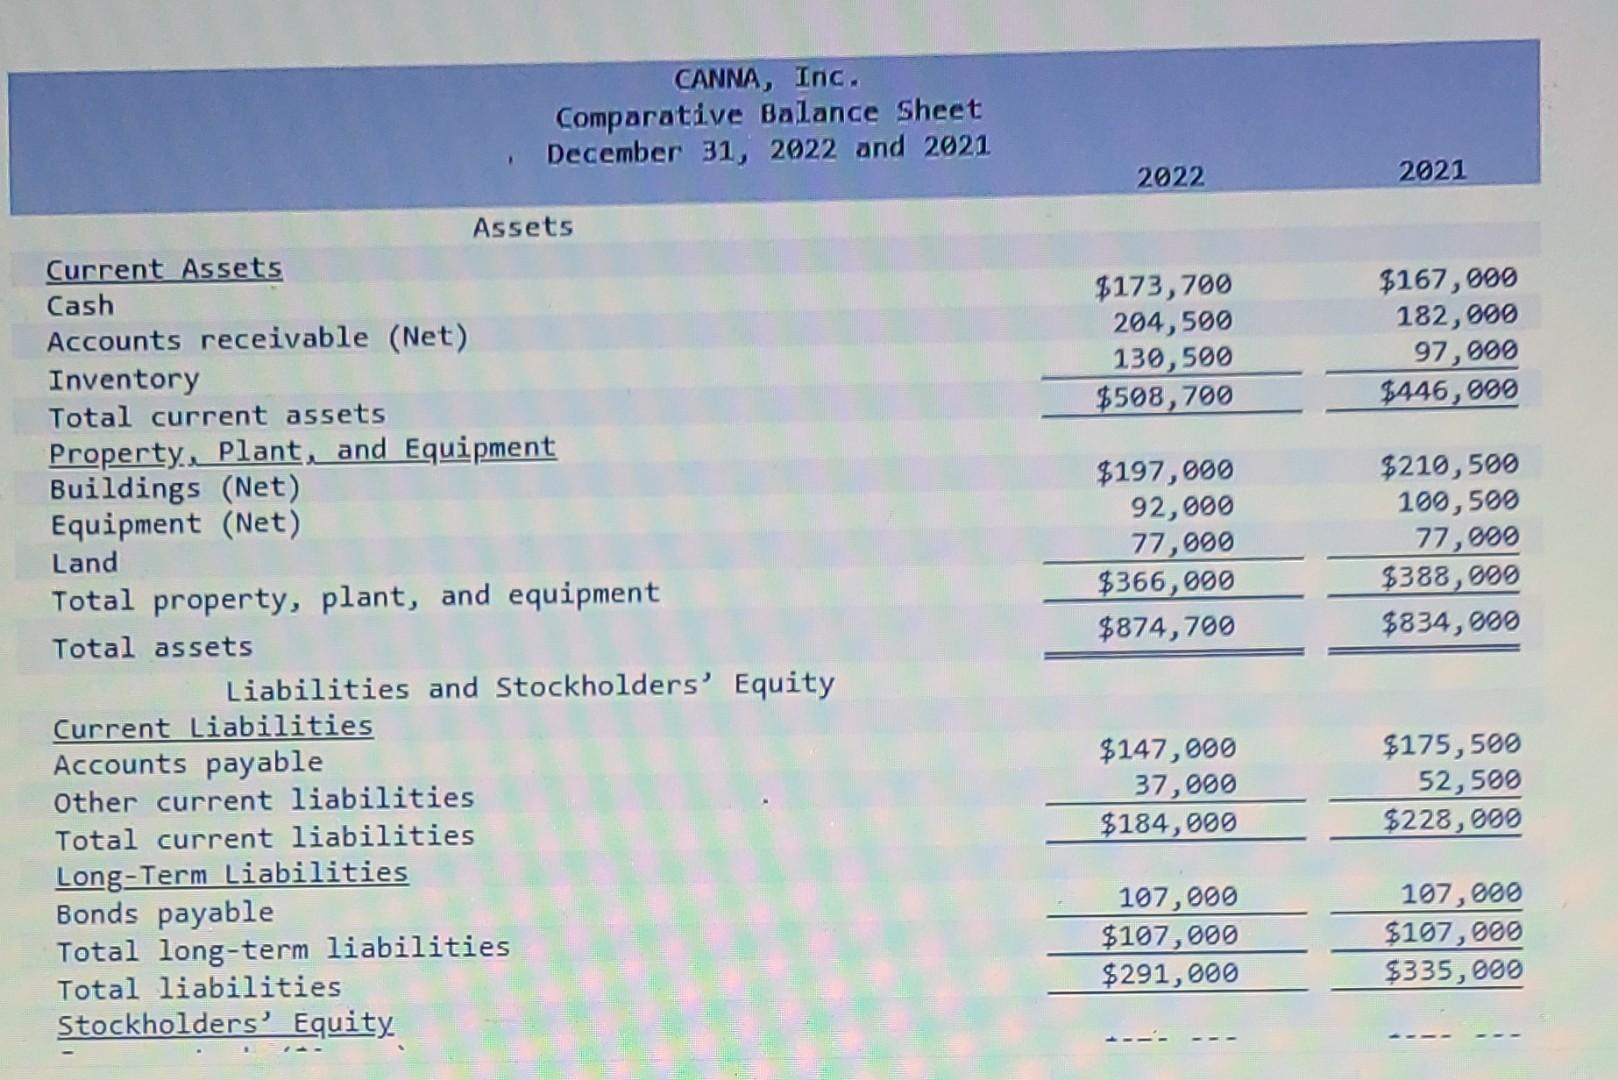
CANNA, Inc. Comparative Balance Sheet December 31, 2022 and 2021 # 2022 2021 $173,700 204,500 130,500 $508,700 $167,000 182,000 97,000 $446,000 Assets Current Assets Cash Accounts receivable (Net) Inventory Total current assets Property. Plant, and Equipment Buildings (Net) Equipment (Net) Land Total property, plant, and equipment Total assets Liabilities and Stockholders' Equity Current Liabilities Accounts payable Other current liabilities Total current liabilities Long-Term Liabilities Bonds payable Total long-term liabilities Total liabilities Stockholders' Equity $197,000 92,000 77,000 $366,000 $874,700 $210,500 100,500 77,800 $388,000 $834,000 $147,000 37,089 $184,800 $175,500 52,500 $228,000 107,000 $107,000 $291,000 107,000 $107,000 $335,000
Step by Step Solution
There are 3 Steps involved in it

Get step-by-step solutions from verified subject matter experts