

Question: solve this question and explain how to solve it ( R studio is be allowed to use in this question) the data for the R
solve this question and explain how to solve it (R studio is be allowed to use in this question)
the data for the R studio
Pounds
2.2
0.3
0.6
1.9
-1.2
0.1
-1.1
-1.2
1.1
2.7
1
-0.4
-0.2
0.1
-2
-2.8
-0.1
-1.1
-1.8
-2.9
-1.2
-1.2
-1.7
-0.9
-1.2
-------
Diet
1
1
1
1
1
2
2
2
2
2
3
3
3
3
3
4
4
4
4
4
5
5
5
5
5
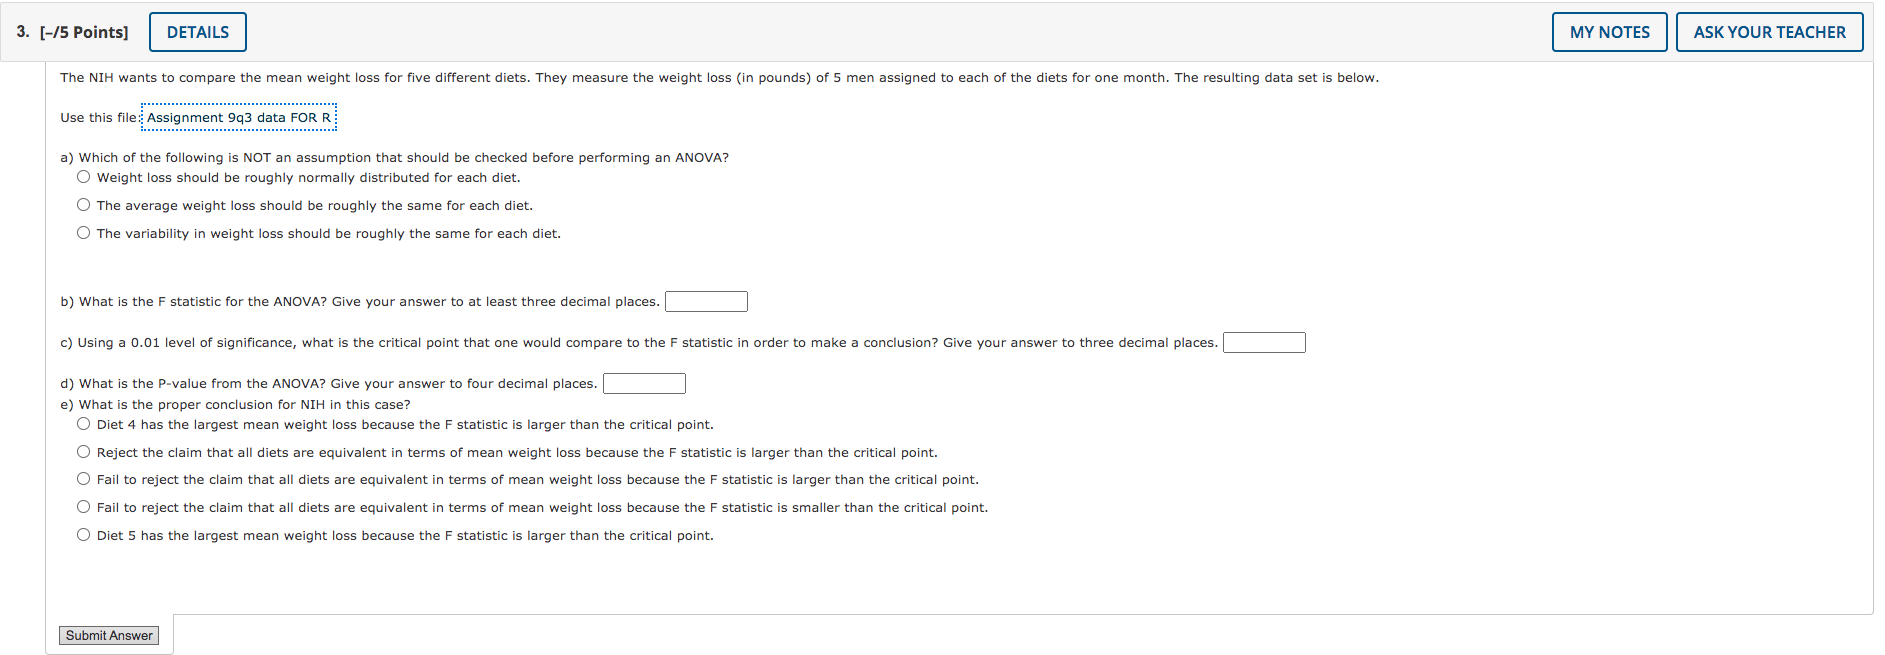
3. [-/5 Points] DETAILS MY NOTES ASK YOUR TEACHER The NIH wants to compare the mean weight loss for five different diets. They measure the weight loss (in pounds) of 5 men assigned to each of the diets for one month. The resulting data set is below. Use this file: Assignment 9q3 data FOR R a) Which of the following is NOT an assumption that should be checked before performing an ANOVA? O Weight loss should be roughly normally distributed for each diet. The average weight loss should be roughly the same for each diet. O The variability in weight loss should be roughly the same for each diet. b) What is the F statistic for the ANOVA? Give your answer to at least three decimal places. c) Using a 0.01 level of significance, what is the critical point that one would compare to the F statistic in order to make a conclusion? Give your answer to three decimal places. d) What is the P-value from the ANOVA? Give your answer to four decimal places. ) What is the proper conclusion for NIH in this case? O Diet 4 has the largest mean weight loss because the F statistic is larger than the critical point. O Reject the claim that all diets are equivalent in terms of mean weight loss because the F statistic is larger than the critical point. O Fail to reject the claim that all diets are equivalent in terms of mean weight loss because the F statistic is larger than the critical point. O Fail to reject the claim that all diets are equivalent in terms of mean weight loss because the F statistic is smaller than the critical point. O Diet 5 has the largest mean weight loss because the F statistic is larger than the critical point. Submit
Step by Step Solution
There are 3 Steps involved in it

Get step-by-step solutions from verified subject matter experts