

Question: solve this question and show answer step by step do it on matlab 3. (5 pts) The temperature (in degrees Fahrenheit) was recorded every three
solve this question and show answer step by step do it on matlab
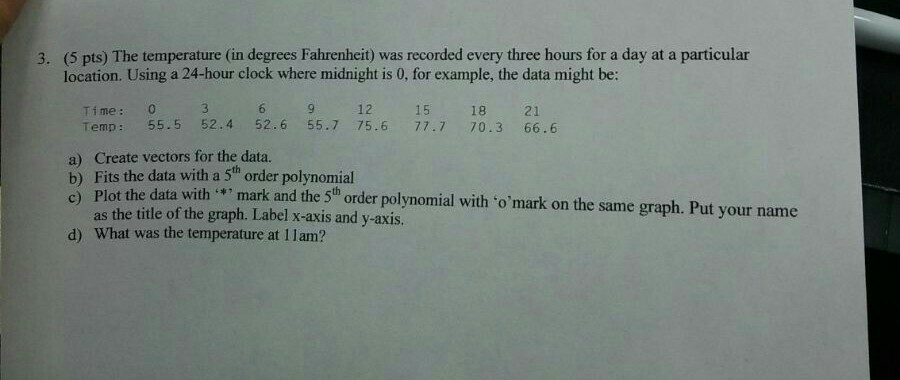
3. (5 pts) The temperature (in degrees Fahrenheit) was recorded every three hours for a day at a particular location. Using a 24-hour clock where midnight is 0, for example, the data might be: Time: 0 6 9 12 15 18 21 Temp: 55.5 52.4 52.6 55.7 75.6 77.7 70.3 66.6 a) Create vectors for the data. b) Fits the data with a 5th order polynomial c) Plot the data with'mark and the 5" order polynomial with 'o'mark on the same graph. Put your name as the title of the graph. Label x-axis and y-axis. d) What was the temperature at 11am
Step by Step Solution
There are 3 Steps involved in it
1 Expert Approved Answer
Step: 1 Unlock

Question Has Been Solved by an Expert!
Get step-by-step solutions from verified subject matter experts
Step: 2 Unlock
Step: 3 Unlock