

Question: solve this question using Minitab. Do not solve it on paper. The following table listed 25 subgroups of measurement data with group size 3: #cl
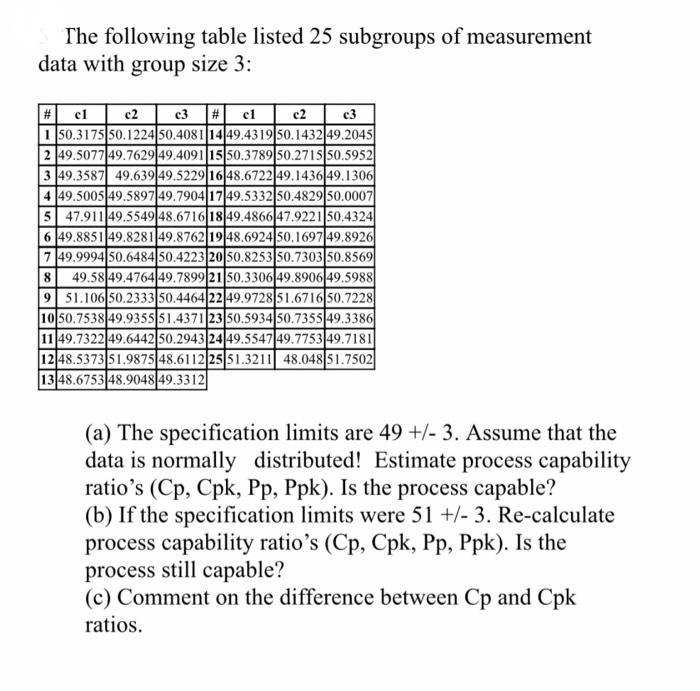
The following table listed 25 subgroups of measurement data with group size 3: #cl c2 c3 #clc2 c3 1 50.3175 50.1224 50.4081 14 49.431950.1432 49.2045 249.5077|49.7629149.4091 15 50.378950.2715 50.5952 3 49.3587| 49.639 49.5229 16 48.6722|49.1436 49.1306 4 49.500549.5897 49.790417 49.5332 50.482950.0007 5 47.911 49.5549 48.6716 18 49.486647.9221 50.4324 6 49.8851 49.8281 49.8762 19 48.6924 50.1697 49.8926 7 49.9994 50.6484 50.4223 20 50.8253 50.7303 50.8569 8 49.58 49.4764 49.789921 50.3306 49.8906 49.5988 9 51.106 50.233350.446422 49.9728 51.6716 50.7228 10 50.7538|49.9355 51.437123 50.5934 50.7355 49.3386 11 49.7322 49.6442 50.2943 2449.554749.7753 49.7181 12 48.5373 51.987548.6112 2551.3211 48.048 51.7502 13 48.675348.9048 49.3312 (a) The specification limits are 49 +/- 3. Assume that the data is normally distributed! Estimate process capa ratio's (Cp, Cpk, Pp, Ppk). Is the process capable? (b) If the specification limits were 51 +/- 3. Re-calculate process capability ratio's (Cp, Cpk, Pp, Ppk). Is the process still capable? (c) Comment on the difference between Cp and Cpk ratios
Step by Step Solution
There are 3 Steps involved in it

Get step-by-step solutions from verified subject matter experts