

Question: SOLVE THROUGH EXCEL AND PROVIDE SCREENSHOTS 3. Determine the linear function using linear regression. Show the step-by-step tabulated solution and the solution for each variable
SOLVE THROUGH EXCEL AND PROVIDE SCREENSHOTS
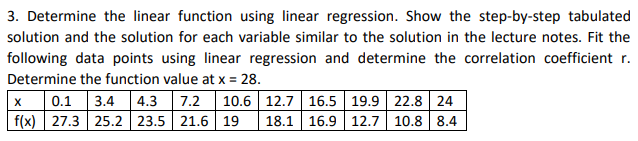
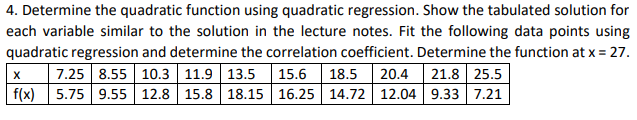
3. Determine the linear function using linear regression. Show the step-by-step tabulated solution and the solution for each variable similar to the solution in the lecture notes. Fit the following data points using linear regression and determine the correlation coefficient r. Determine the function value at x = 28. X 0.1 3.4 4.3 7.2 10.6 12.7 16.5 19.9 22.8 24 f(x) 27.3 25.2 23.5 21.6 19 18.1 16.9 12.7 10.8 8.4 4. Determine the quadratic function using quadratic regression. Show the tabulated solution for each variable similar to the solution in the lecture notes. Fit the following data points using quadratic regression and determine the correlation coefficient. Determine the function at x = 27. X 7.25 8.55 10.3 11.9 13.5 15.6 18.5 20.4 f(x) 5.75 9.55 12.8 15.8 18.15 16.25 14.72 12.04 21.8 25.5 9.33 7.21 3. Determine the linear function using linear regression. Show the step-by-step tabulated solution and the solution for each variable similar to the solution in the lecture notes. Fit the following data points using linear regression and determine the correlation coefficient r. Determine the function value at x = 28. X 0.1 3.4 4.3 7.2 10.6 12.7 16.5 19.9 22.8 24 f(x) 27.3 25.2 23.5 21.6 19 18.1 16.9 12.7 10.8 8.4 4. Determine the quadratic function using quadratic regression. Show the tabulated solution for each variable similar to the solution in the lecture notes. Fit the following data points using quadratic regression and determine the correlation coefficient. Determine the function at x = 27. X 7.25 8.55 10.3 11.9 13.5 15.6 18.5 20.4 f(x) 5.75 9.55 12.8 15.8 18.15 16.25 14.72 12.04 21.8 25.5 9.33 7.21
Step by Step Solution
There are 3 Steps involved in it

Get step-by-step solutions from verified subject matter experts