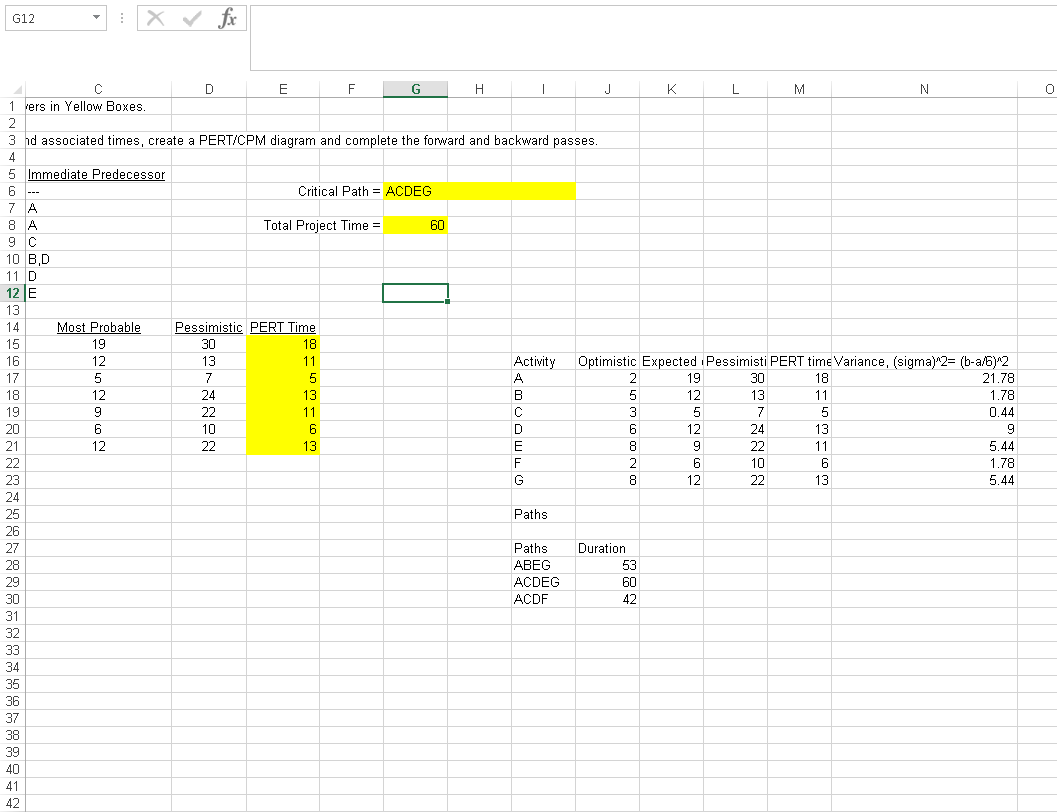
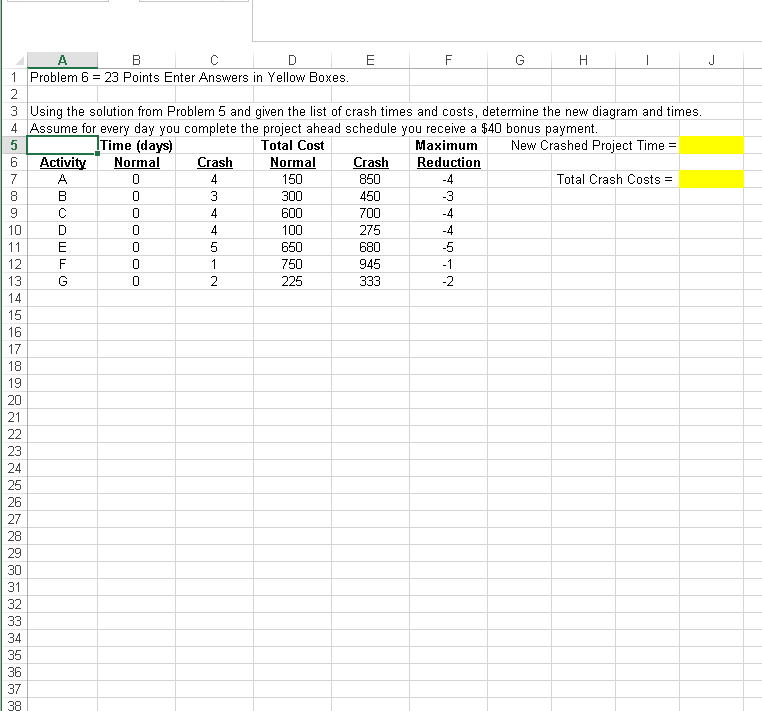
Question: Solve Using Excel G12 : x fc 0 5 D E F G . J K L M N 1 ers in Yellow Boxes, 2

Solve Using Excel

Solve Using Excel G12 : x fc 0 5 D E F G . J K LSolve Using Excel G12 : x fc 0 5 D E F G . J K L

G12 : x fc 0 5 D E F G . J K L M N 1 ers in Yellow Boxes, 2 3 d associated times, create a PERT/CPM diagram and complete the forward and backward passes. 4 5 Immediate Predecessor 6 Critical Path = ACDEG 7 A 8 A Total Project Time = 60 9 C 10 BD 11 D 12 E 13 14 Most Probable Pessimistic PERT Time 15 19 30 18 16 12 13 11 Activity Optimistic Expected Pessimisti PERT time Variance, (sigma)"2= (b-a/6)^2 17 5 7 5 A 2 19 30 18 21.78 18 12 24 13 B 12 13 11 1.78 19 9 22 11 C 3 5 7 5 0.44 20 6 10 6 D 6 12 24 13 9 21 12 22 13 E 8 9 22 11 5.44 22 F 2 6 10 6 1.78 23 G 8 12 22 13 5.44 24 25 Paths 26 27 Paths Duration 28 ABEG 53 29 ACDEG 60 30 ACDF 42 31 32 33 34 35 36 37 38 39 40 41 42 J OOOOOOO 1 A B E F H 1 Problem 6 = 23 Points Enter Answers in Yellow Boxes. 2 3 Using the solution from Problem 5 and given the list of crash times and costs, determine the new diagram and times. 4 Assume for every day you complete the project ahead schedule you receive a $40 bonus payment. 5 Time (days) Total Cost Maximum New Crashed Project Time = 6 Activity Normal Crash Normal Crash Reduction 7 . 4 150 850 -4 Total Crash Costs = 8 B 3 300 450 -3 9 C 4 600 700 -4 10 D 4 100 275 -4 11 E 5 650 680 -5 12 F 750 945 -1 13 G 2 225 333 -2 14 15 16 17 18 19 20 21 22 23 24 25 26 27 28 29 30 31 32 33 34 35 36 37 38

Step by Step Solution

There are 3 Steps involved in it

1 Expert Approved Answer
Step: 1 Unlock blur-text-image
Question Has Been Solved by an Expert!

Get step-by-step solutions from verified subject matter experts

Step: 2 Unlock
Step: 3 Unlock

Students Have Also Explored These Related General Management Questions!