

Question: SOLVE USING EXCEL SOLVER!! A mining company excavates a resource at 3 sites and sells it on 5 markets. The annual production at each site
SOLVE USING EXCEL SOLVER!!
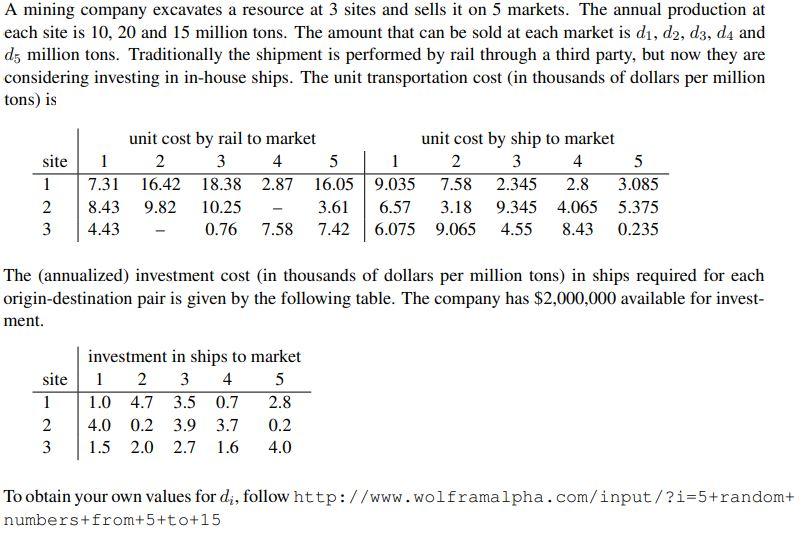
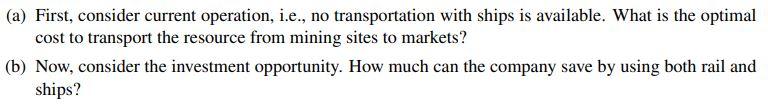
A mining company excavates a resource at 3 sites and sells it on 5 markets. The annual production at each site is 10, 20 and 15 million tons. The amount that can be sold at each market is di, d2, d3, d4 and d5 million tons. Traditionally the shipment is performed by rail through a third party, but now they are considering investing in in-house ships. The unit transportation cost (in thousands of dollars per million tons) is site 1 2 3 1 7.31 8.43 4.43 unit cost by rail to market unit cost by ship to market 2 3 4 5 1 2 3 4 5 16.42 18.38 2.87 16.05 9.035 7.58 2.345 2.8 3.085 9.82 10.25 3.61 6.57 3.18 9.345 4.065 5.375 0.76 7.58 7.42 6.075 9.065 4.55 8.43 0.235 The annualized) investment cost (in thousands of dollars per million tons) in ships required for each origin-destination pair is given by the following table. The company has $2,000,000 available for invest- ment. investment in ships to market site 1 2 3 4 5 1 1.0 4.7 3.5 0.7 2.8 2 4.0 0.2 3.9 3.7 0.2 3 1.5 2.0 2.7 1.6 4.0 To obtain your own values for di, follow http://www.wolframalpha.com/input/?i=5+random+ numbers+from+5+to+15 (a) First, consider current operation, i.e., no transportation with ships is available. What is the optimal cost to transport the resource from mining sites to markets? (b) Now, consider the investment opportunity. How much can the company save by using both rail and ships? A mining company excavates a resource at 3 sites and sells it on 5 markets. The annual production at each site is 10, 20 and 15 million tons. The amount that can be sold at each market is di, d2, d3, d4 and d5 million tons. Traditionally the shipment is performed by rail through a third party, but now they are considering investing in in-house ships. The unit transportation cost (in thousands of dollars per million tons) is site 1 2 3 1 7.31 8.43 4.43 unit cost by rail to market unit cost by ship to market 2 3 4 5 1 2 3 4 5 16.42 18.38 2.87 16.05 9.035 7.58 2.345 2.8 3.085 9.82 10.25 3.61 6.57 3.18 9.345 4.065 5.375 0.76 7.58 7.42 6.075 9.065 4.55 8.43 0.235 The annualized) investment cost (in thousands of dollars per million tons) in ships required for each origin-destination pair is given by the following table. The company has $2,000,000 available for invest- ment. investment in ships to market site 1 2 3 4 5 1 1.0 4.7 3.5 0.7 2.8 2 4.0 0.2 3.9 3.7 0.2 3 1.5 2.0 2.7 1.6 4.0 To obtain your own values for di, follow http://www.wolframalpha.com/input/?i=5+random+ numbers+from+5+to+15 (a) First, consider current operation, i.e., no transportation with ships is available. What is the optimal cost to transport the resource from mining sites to markets? (b) Now, consider the investment opportunity. How much can the company save by using both rail and shipsStep by Step Solution
There are 3 Steps involved in it
1 Expert Approved Answer
Step: 1 Unlock

Question Has Been Solved by an Expert!
Get step-by-step solutions from verified subject matter experts
Step: 2 Unlock
Step: 3 Unlock