

Question: Solve using matlab, As Soon As possible The following table shows experimental measurements for the voltage (in V) for a resistance that is fed with
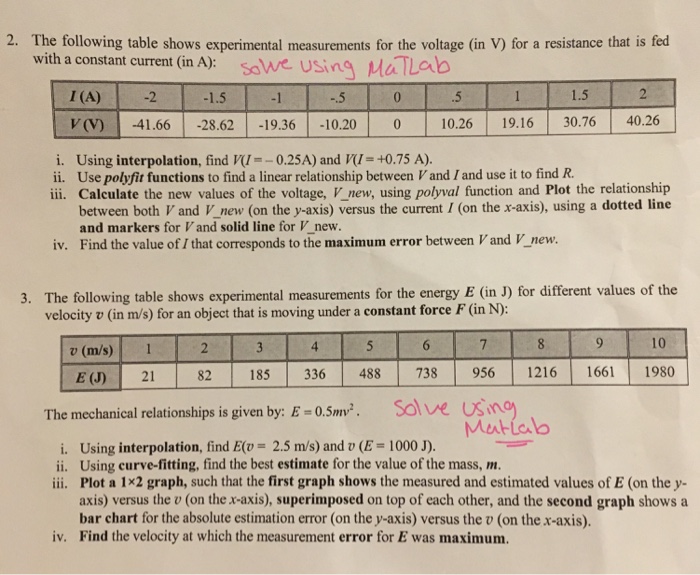
The following table shows experimental measurements for the voltage (in V) for a resistance that is fed with a constant current (in A): i. Using interpolation, find V(I = -0.25A) and V(I = +0.75 A). ii. Use polyfit functions to find a linear relationship between V and I and use it to find R. iii. Calculate the new values of the voltage, V_new, using polyval function and Plot the relationship between both V and V_new (on the y-axis) versus the current I (on the x-axis), using a dotted line and markers for V and solid line for V_new. iv. Find the value of I that corresponds to the maximum error between Vand V_new. The following table shows experimental measurements for the energy E (in J) for different values of the velocity v (in m/s) for an object that is moving under a constant force F (in N): The mechanical relationships is given by: E = 0.5mv^2. i. Using interpolation, find E(v = 2.5 m/s) and V(E = 1000 J). ii. Using curve-fitting, find the best estimate for the value of the mass, m. iii. Plot a 1 times 2 graph, such that the first graph shows the measured and estimated values of E (on the y-axis) versus the v (on the x-axis), superimposed on top of each other, and the second graph shows a bar chart for the absolute estimation error (on the y-axis) versus the v (on the x-axis). iv. Find the velocity at which the measurement error for E was maximum
Step by Step Solution
There are 3 Steps involved in it

Get step-by-step solutions from verified subject matter experts