

Question: Solve using MATLAB Experiment 4.2 (a) In a single figure plot three 2-D line graphs of good resolution defined, respectively, as follows: fi(t) = 5t
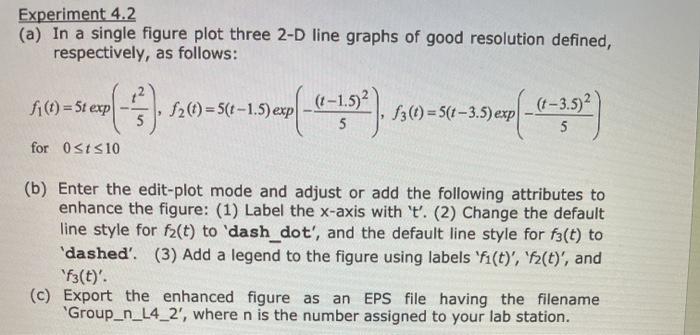
Experiment 4.2 (a) In a single figure plot three 2-D line graphs of good resolution defined, respectively, as follows: fi(t) = 5t exp 2(t) = 5(1-1.5) exp (1-1.5)2 5 13(t) = 5(t-3.5) exp 1,500 (t-3.52 5 for Osts10 (b) Enter the edit-plot mode and adjust or add the following attributes to enhance the figure: (1) Label the x-axis with 't'. (2) Change the default line style for f(t) to 'dash_dot', and the default line style for fz(t) to dashed'. (3) Add a legend to the figure using labels 'fi(t)', '42(t)', and "f3(t)'. (c) Export the enhanced figure as an EPS file having the filename 'Group_n_L4_2", where n is the number assigned to your lab station
Step by Step Solution
There are 3 Steps involved in it

Get step-by-step solutions from verified subject matter experts