

Question: solve using matlab . the gragh should look like the one above Beta Distribution The Beta distribution can be used in analysis of population genetics,
 solve using matlab .
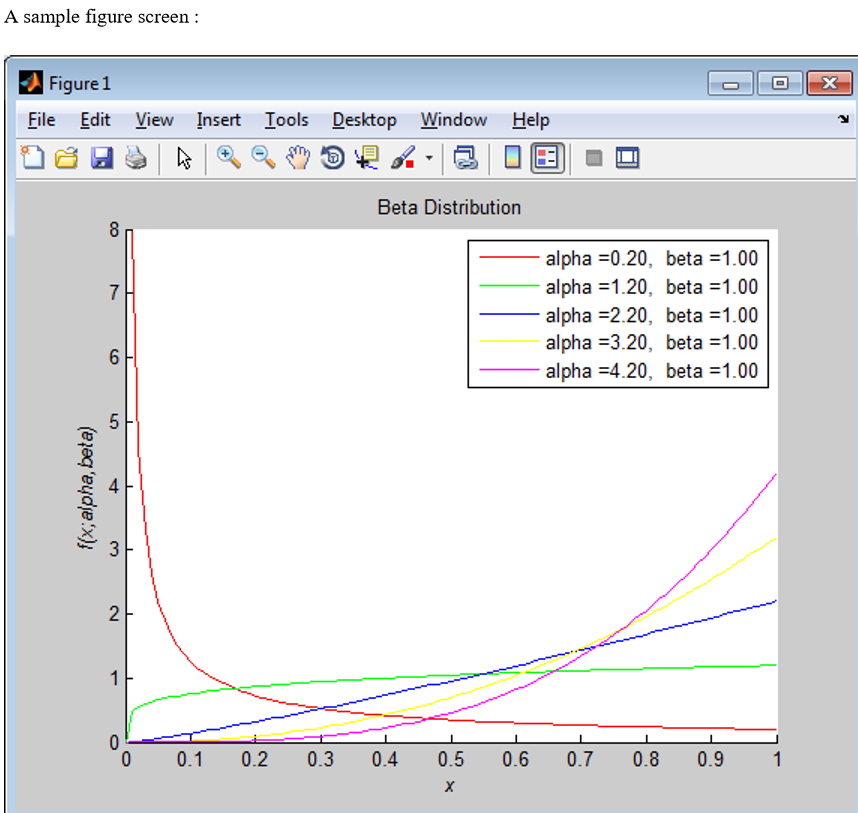
the gragh should look like the one above
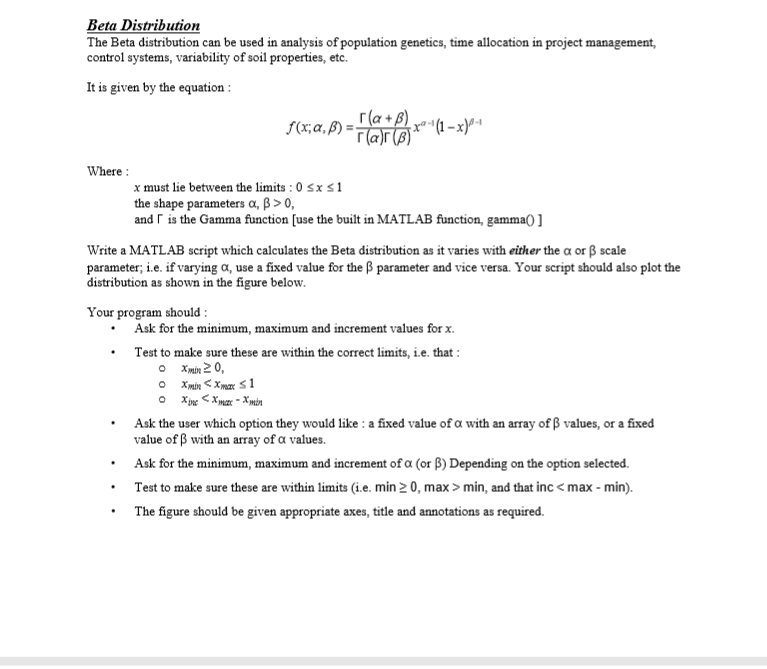
Beta Distribution The Beta distribution can be used in analysis of population genetics, time allocation in project management, control systems, variability of soil properties, etc. It is given by the equation: 5(8:2, 6) = Fila | * *(1-x)+ Where: x must lie between the limits : 0 SX S1 the shape parameters a, >0, and is the Gamma function (use the built in MATLAB function, gammal Write a MATLAB script which calculates the Beta distribution as it varies with either the aor B scale parameter, i.e. if varying a, use a fixed value for the parameter and vice versa. Your script should also plot the distribution as shown in the figure below. Your program should : Ask for the minimum, maximum and increment values for x. Test to make sure these are within the correct limits, i.e. that: OX min 20, Xie Xwaz 31 Xe X Max - XNA Ask the user which option they would like: a fixed value of a with an array of B values, or a fixed value of with an array of a values. Ask for the minimum, maximum and increment of a (or B) Depending on the option selected. Test to make sure these are within limits (i.e. min > 0, max > min, and that inc
Step by Step Solution
There are 3 Steps involved in it

Get step-by-step solutions from verified subject matter experts