

Question: Solve using MATLAB Write a MATLAB script that will create the following vectors: t = 0:pi/100:2 astir pi, y1 = -1/2cos(2t), y2 = 2cos(2t), and
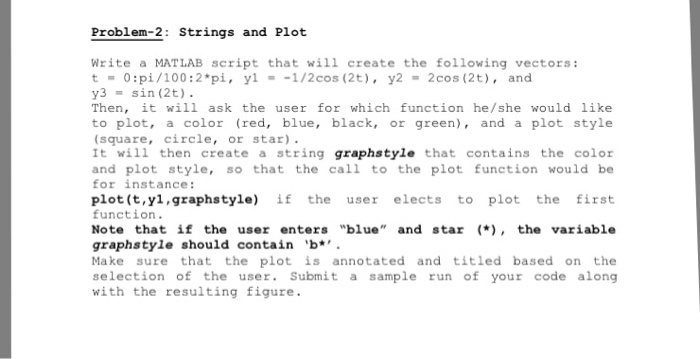
Write a MATLAB script that will create the following vectors: t = 0:pi/100:2 astir pi, y1 = -1/2cos(2t), y2 = 2cos(2t), and y3 = sin (2t). Then, it will ask the user for which function he/she would like to plot, a color (red, blue, black, or green), and a plot style (square, circle, or star). It will then create a string graphstyle that contains the color and plot style, so that the call to the plot function would be for instance: plot(t, yl, graphstyle) if the user elects to plot the first function. Not that if the user enters "blue" and star (astir), the variable graphstyle should contain 'b astir '. Make sure that the plot is annotated and titled based on the selection of the user. Submit a sample run of your code along with the resulting figure
Step by Step Solution
There are 3 Steps involved in it

Get step-by-step solutions from verified subject matter experts