

Question: solve using Octave. Include input and output. Thanks (d) Draw a graph of the population of the USA from 1790 to 2000 , utilizing the
 solve using Octave. Include input and output. Thanks
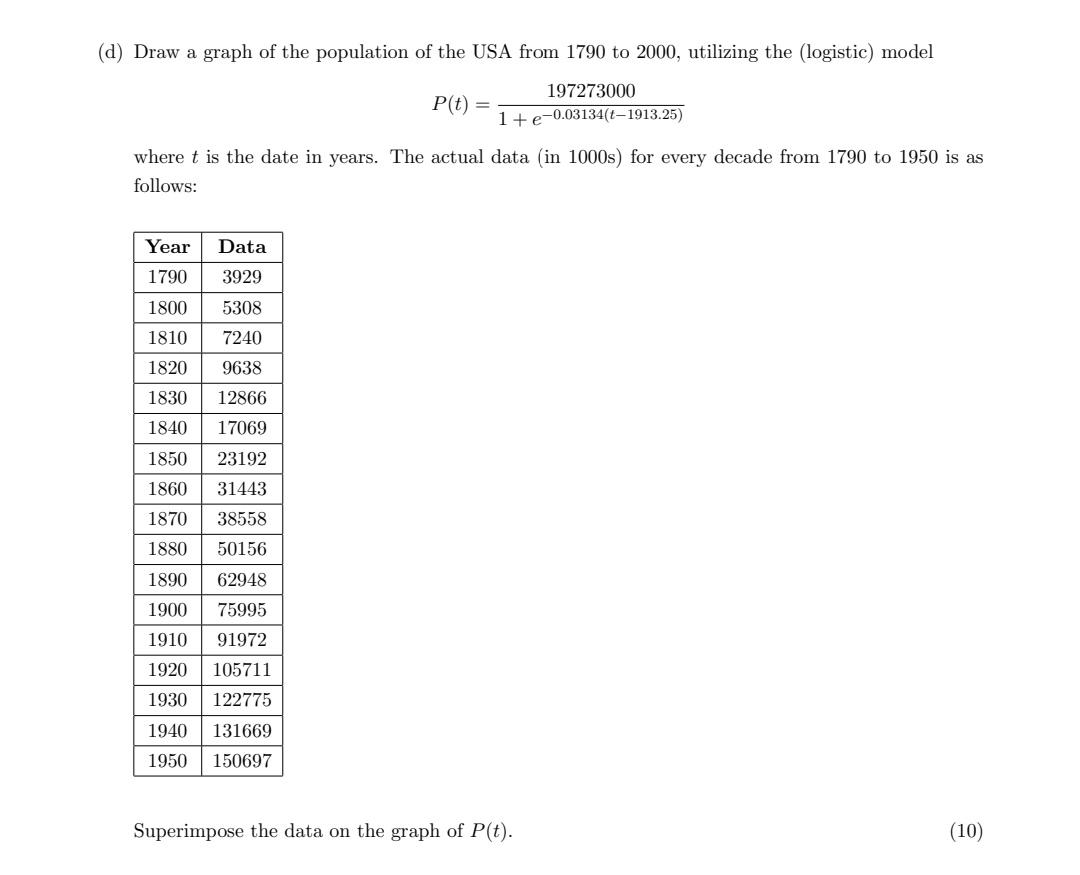
(d) Draw a graph of the population of the USA from 1790 to 2000 , utilizing the (logistic) model P(t)=1+e0.03134(t1913.25)197273000 where t is the date in years. The actual data (in 1000s) for every decade from 1790 to 1950 is as follows: Vose Dota Superimpose the data on the graph of P(t)
Step by Step Solution
There are 3 Steps involved in it
1 Expert Approved Answer
Step: 1 Unlock

Question Has Been Solved by an Expert!
Get step-by-step solutions from verified subject matter experts
Step: 2 Unlock
Step: 3 Unlock