

Question: Solve using the R statistical computing platform. Include the code you wrote and list any mathematical assumptions about what method you are using. I know
Solve using the R statistical computing platform. Include the code you wrote andlist any mathematical assumptions about what method you are using.
I know it is similar to example 14.8.1 and 14.5.1 provided below after the question but I cannot seem to compute the code.
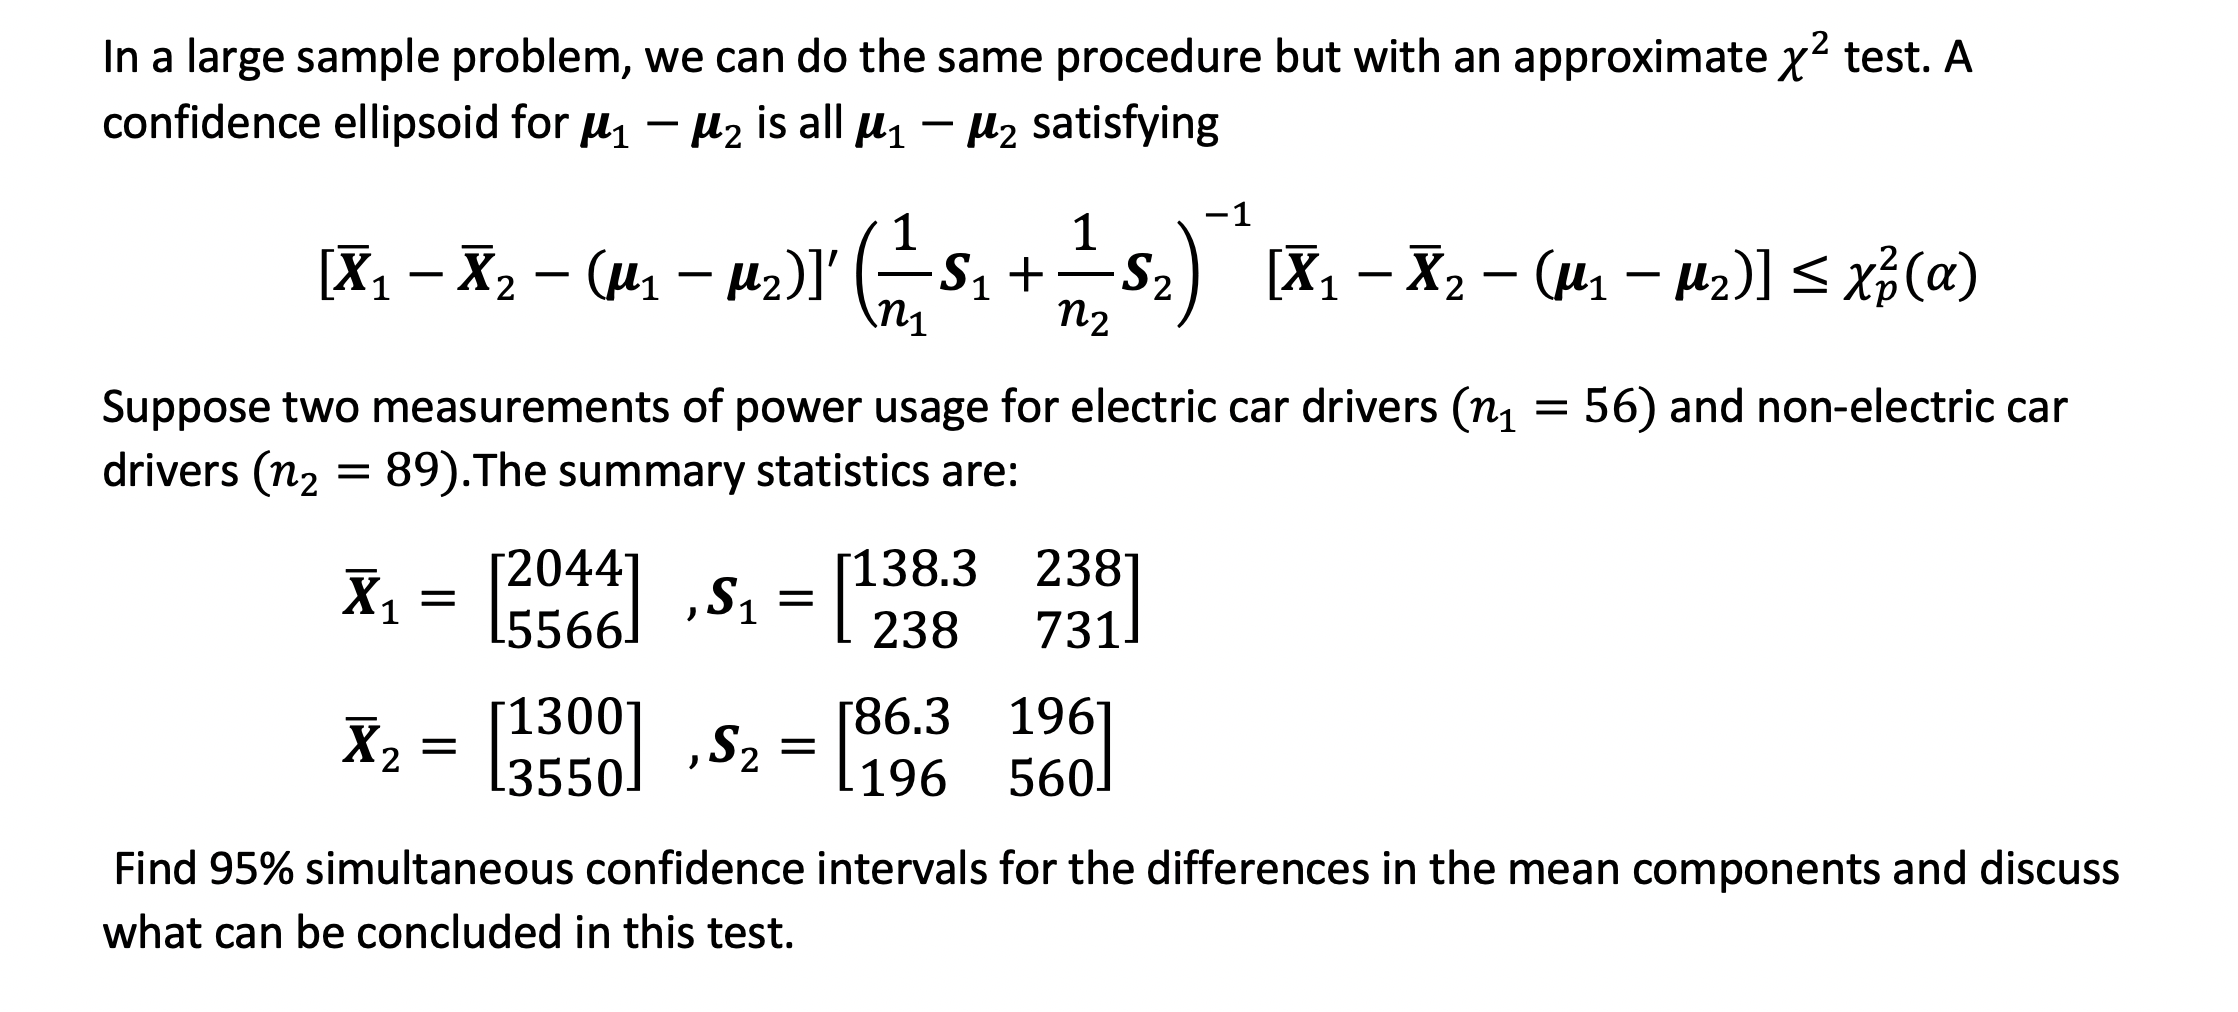
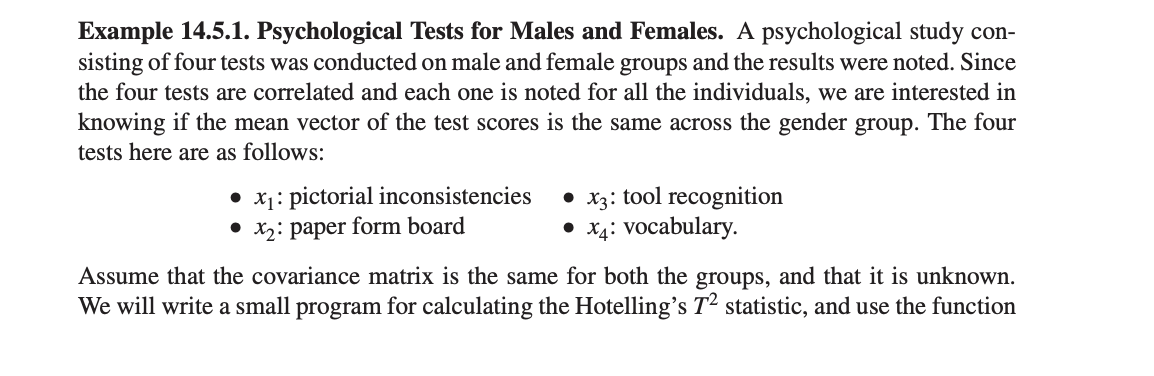
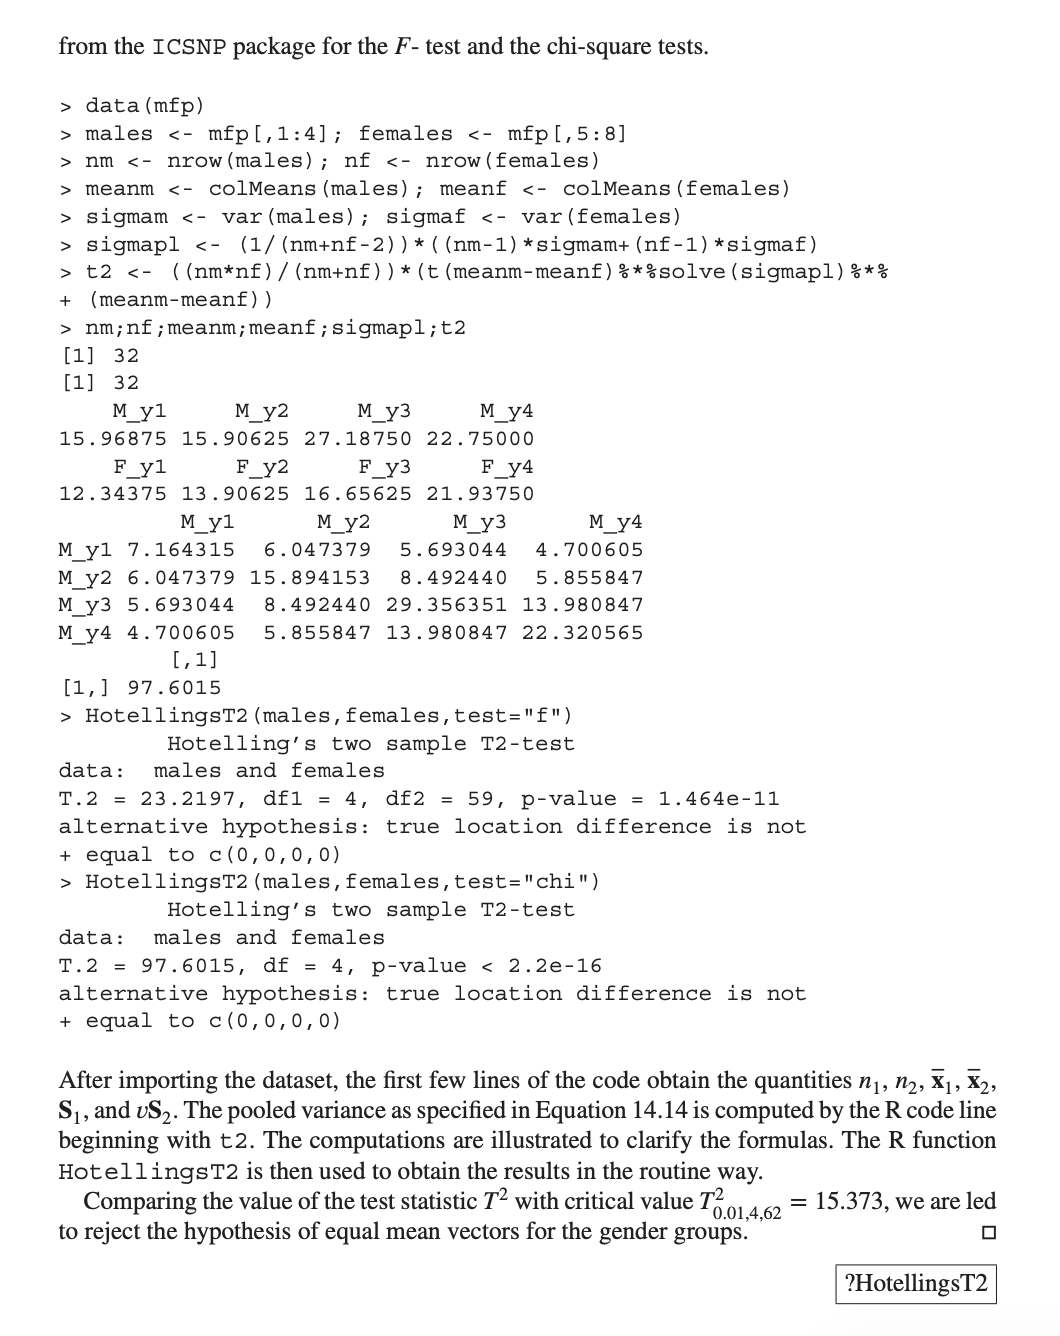
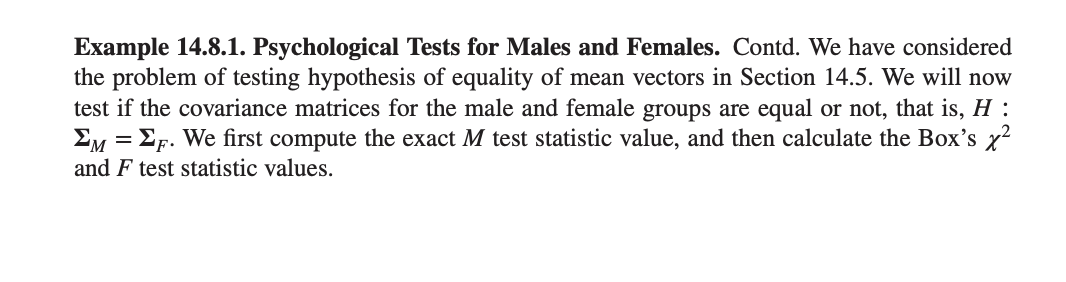
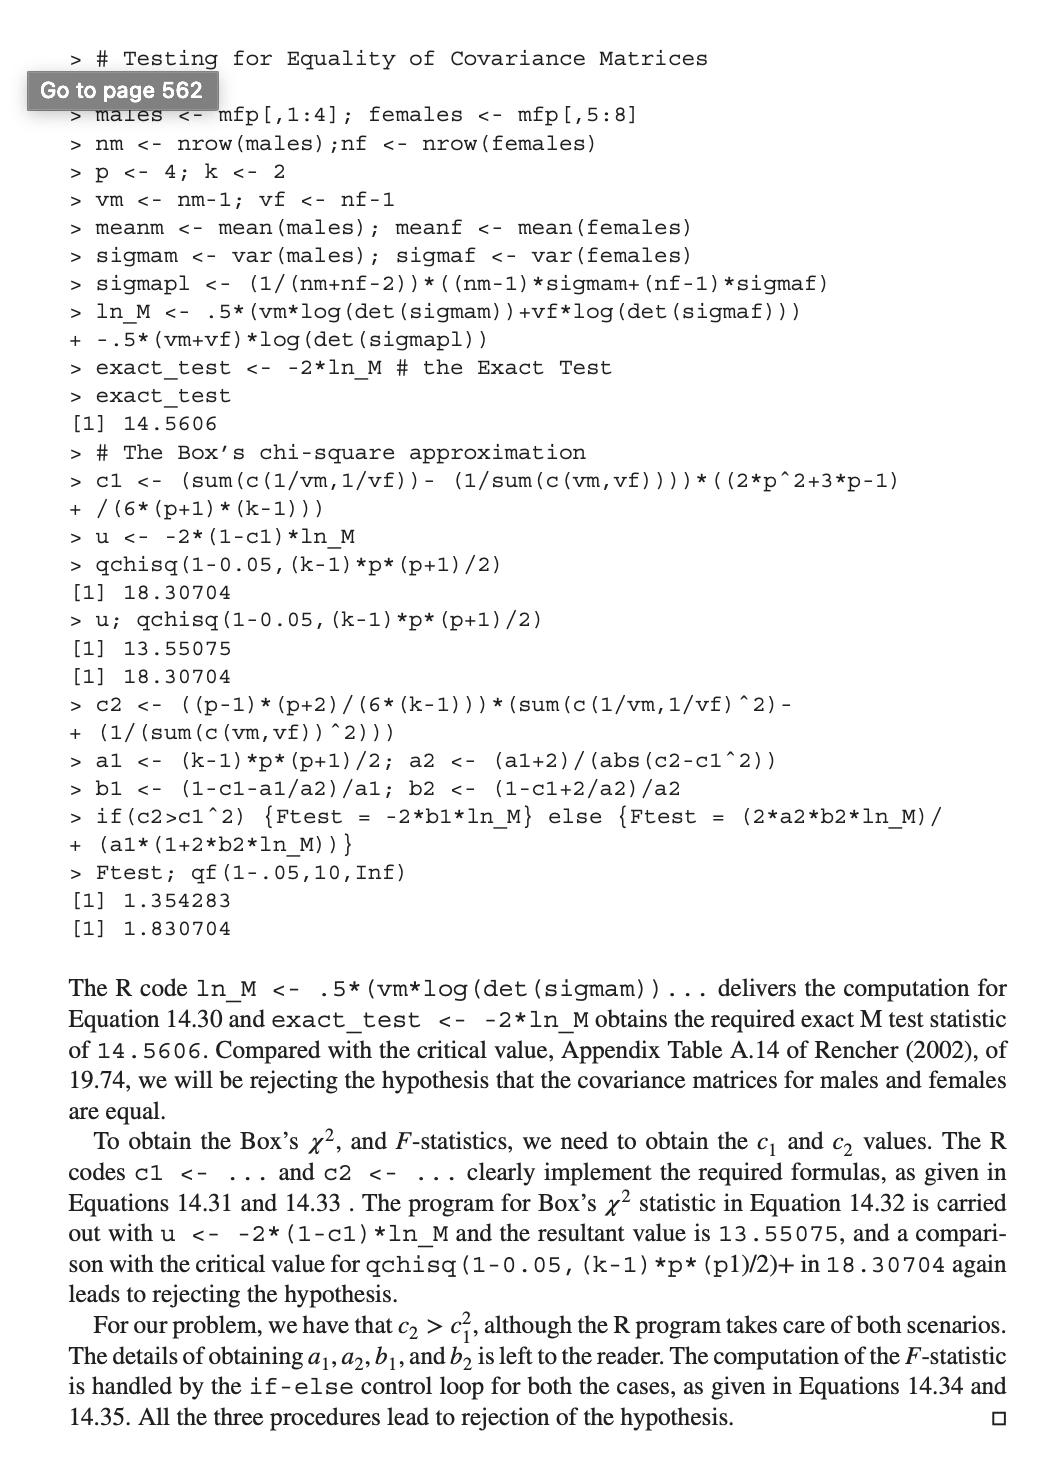
In a large sample problem, we can do the same procedure but with an approximate x2 test. A confidence ellipsoid for [11 [12 is all [11 [12 satisfying _ _ 1 1 '1 _ _ [X1 X2 (#1 #2)], ("51 + 11252) [X1 X2 (#1 #2)] S X12201) 1 Suppose two measurements of power usage for electric car drivers (111 = 56) and non-electric car drivers (112 = 89).The summary statistics are: [3:221 113:: 3:: @2231 52422-2 :23 Find 95% simultaneous confidence intervals for the differences in the mean components and discuss what can be concluded in this test. Example 14.5.1. Psychological Tests for Males and Females. A psychological study con- sisting of four tests was conducted on male and female groups and the results were noted. Since the four tests are correlated and each one is noted for all the individuals, we are interested in knowing if the mean vector of the test scores is the same across the gender group. The four tests here are as follows: it x1: pictorial inconsistencies . x3: tool recognition it xx): paper form board . x4: vocabulary. Assume that the covariance matrix is the same for both the groups, and that it is unknown. We will write a small program for calculating the Hotelling's 1"2 statistic, and use the function from the ICSNP package for the F- test and the chi-square tests. > data (mfp) >males nm meanm t2 nm; nf ; meanm; meanf ; sigmapl ; t2 [1] 32 [1] 32 M y1 M y2 M y3 M y4 15. 96875 15. 90625 27. 18750 22. 75000 F y1 F y2 F y3 F y4 12. 34375 13 . 90625 16. 65625 21.93750 M y1 M y2 My3 M y4 My1 7. 164315 6. 047379 5. 693044 4 . 700605 My2 6. 047379 15. 894153 8 . 492440 5 . 855847 My3 5. 693044 8. 492440 29. 356351 13.980847 M y4 4. 700605 5. 855847 13 . 980847 22.320565 [, 1] [1, ] 97 . 6015 > HotellingsT2 (males, females, test="f") Hotelling's two sample T2-test data : males and females T. 2 = 23.2197, df1 = 4, df2 = 59, p-value = 1. 464e-11 alternative hypothesis: true location difference is not equal to c (0, 0, 0, 0) HotellingsT2 (males, females, test="chi") Hotelling's two sample T2-test data : males and females T. 2 = 97. 6015, df = 4, p-value # Testing for Equality of Covariance Matrices Go to page 562 males p vm meanm sigmapl exact_test [1] 14. 5606 # The Box's chi-square approximation > cl u qchisq (1-0. 05, (k-1) *p* (p+1) /2) [1] 18. 30704 >u; qchisq (1-0 . 05, (k-1) *p* (p+1) /2) [1] 13 . 55075 [1] 18.30704 > c2 al bl c1 2) {Ftest = -2*b1*In_M} else {Ftest = (2*a2*b2*In_M) / + (al* (1+2*b2*In_M) ) } Ftest; qf (1- . 05, 10, Inf) [1] 1. 354283 [1] 1. 830704 The R code In M ca, although the R program takes care of both scenarios. The details of obtaining a 1, a2, b1, and b2 is left to the reader. The computation of the F-statistic is handled by the if-else control loop for both the cases, as given in Equations 14.34 and 14.35. All the three procedures lead to rejection of the hypothesis
Step by Step Solution
There are 3 Steps involved in it

Get step-by-step solutions from verified subject matter experts