

Question: Solve with excel? . You are given with the following information about 4 asset returns in Table 1. The (subjective) probability distribution is shown that
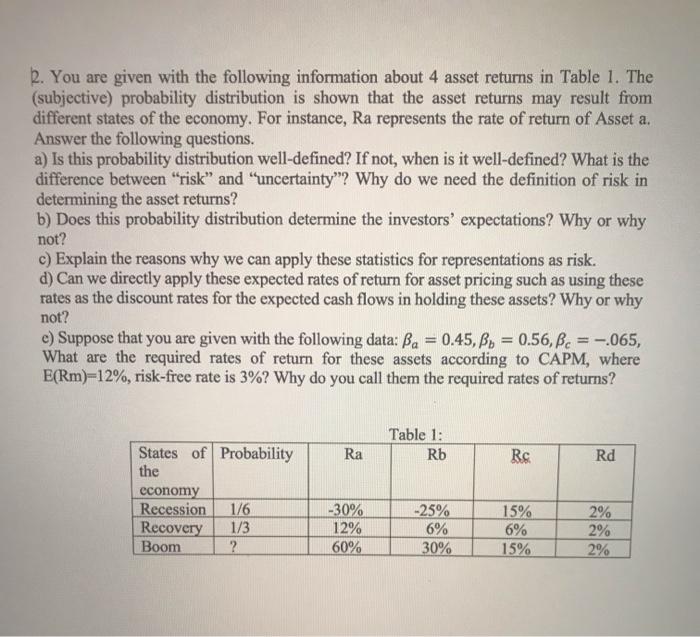
. You are given with the following information about 4 asset returns in Table 1. The (subjective) probability distribution is shown that the asset returns may result from different states of the economy. For instance, Ra represents the rate of return of Asset a. Answer the following questions. a) Is this probability distribution well-defined? If not, when is it well-defined? What is the difference between "risk" and "uncertainty"? Why do we need the definition of risk in determining the asset returns? b) Does this probability distribution determine the investors' expectations? Why or why not? c) Explain the reasons why we can apply these statistics for representations as risk. d) Can we directly apply these expected rates of return for asset pricing such as using these rates as the discount rates for the expected cash flows in holding these assets? Why or why not? c) Suppose that you are given with the following data: Ba = 0.45, By = 0.56,Bc = -.065, What are the required rates of return for these assets according to CAPM, where E(Rm)=12%, risk-free rate is 3%? Why do you call them the required rates of returns? Table 1: Rb Ra Rs Rd States of Probability the economy Recession 1/6 Recovery 1/3 Boom ? -30% 12% 60% -25% 6% 30% 15% 6% 15% 2% 2% 2% . You are given with the following information about 4 asset returns in Table 1. The (subjective) probability distribution is shown that the asset returns may result from different states of the economy. For instance, Ra represents the rate of return of Asset a. Answer the following questions. a) Is this probability distribution well-defined? If not, when is it well-defined? What is the difference between "risk" and "uncertainty"? Why do we need the definition of risk in determining the asset returns? b) Does this probability distribution determine the investors' expectations? Why or why not? c) Explain the reasons why we can apply these statistics for representations as risk. d) Can we directly apply these expected rates of return for asset pricing such as using these rates as the discount rates for the expected cash flows in holding these assets? Why or why not? c) Suppose that you are given with the following data: Ba = 0.45, By = 0.56,Bc = -.065, What are the required rates of return for these assets according to CAPM, where E(Rm)=12%, risk-free rate is 3%? Why do you call them the required rates of returns? Table 1: Rb Ra Rs Rd States of Probability the economy Recession 1/6 Recovery 1/3 Boom ? -30% 12% 60% -25% 6% 30% 15% 6% 15% 2% 2% 2%
Step by Step Solution
There are 3 Steps involved in it

Get step-by-step solutions from verified subject matter experts