

Question: Solve with MATLAB! Part 1: Concentration profile using finite difference approximation Equation 4 shows a changing concentration with respect to radial position as well as
Solve with MATLAB!
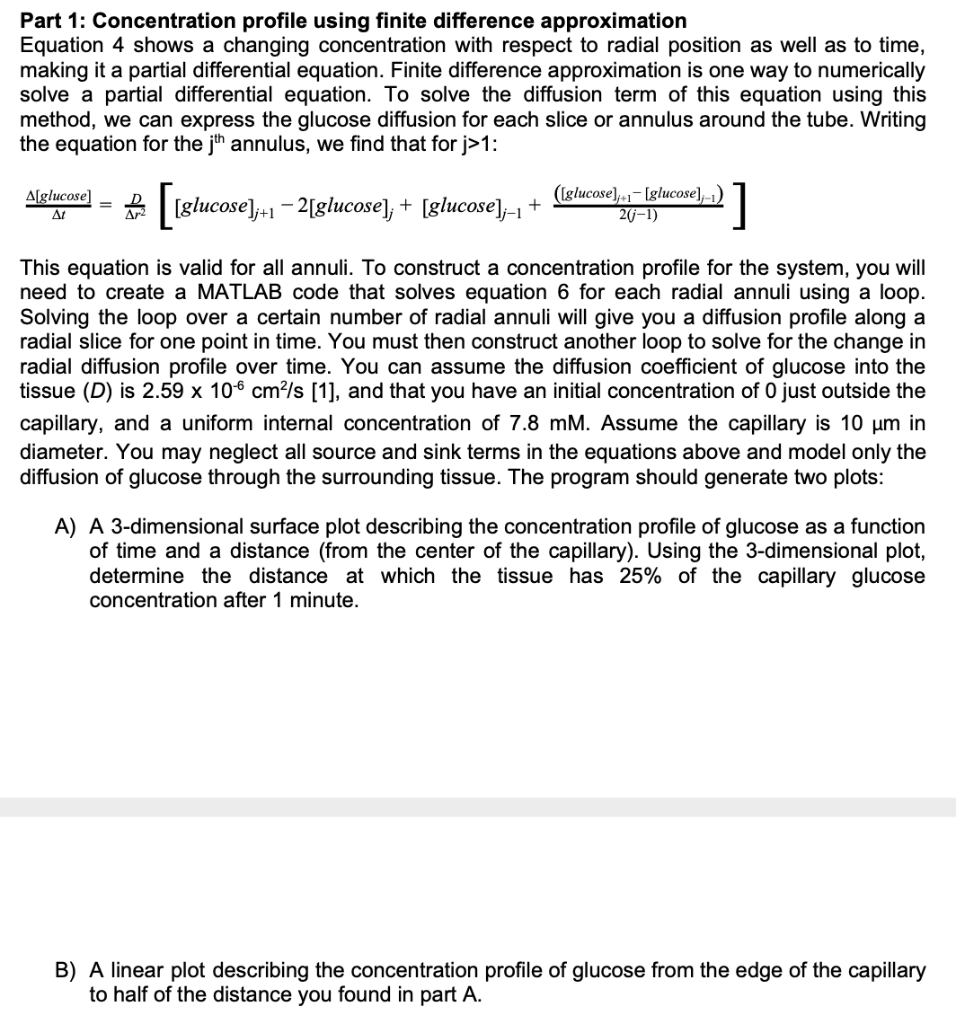
Part 1: Concentration profile using finite difference approximation Equation 4 shows a changing concentration with respect to radial position as well as to time, making it a partial differential equation. Finite difference approximation is one way to numerically solve a partial differential equation. To solve the diffusion term of this equation using this method, we can express the glucose diffusion for each slice or annulus around the tube. Writing the equation for the annulus, we find that for j>1: A[glucose) [[glucose);+ 2[glucose), + (glucose),-1 + ((glucose), - - - [glucose),-1) 24-1) P] Ar2 This equation is valid for all annuli. To construct a concentration profile for the system, you will need to create a MATLAB code that solves equation 6 for each radial annuli using a loop. Solving the loop over a certain number of radial annuli will give you a diffusion profile along a radial slice for one point in time. You must then construct another loop to solve for the change in radial diffusion profile over time. You can assume the diffusion coefficient of glucose into the tissue (D) is 2.59 x 106 cm/s [1], and that you have an initial concentration of O just outside the capillary, and a uniform internal concentration of 7.8 mM. Assume the capillary is 10 um in diameter. You may neglect all source and sink terms in the equations above and model only the diffusion of glucose through the surrounding tissue. The program should generate two plots: A) A 3-dimensional surface plot describing the concentration profile of glucose as a function of time and a distance (from the center of the capillary). Using the 3-dimensional plot, determine the distance at which the tissue has 25% of the capillary glucose concentration after 1 minute. B) A linear plot describing the concentration profile of glucose from the edge of the capillary to half of the distance you found in part A. Part 1: Concentration profile using finite difference approximation Equation 4 shows a changing concentration with respect to radial position as well as to time, making it a partial differential equation. Finite difference approximation is one way to numerically solve a partial differential equation. To solve the diffusion term of this equation using this method, we can express the glucose diffusion for each slice or annulus around the tube. Writing the equation for the annulus, we find that for j>1: A[glucose) [[glucose);+ 2[glucose), + (glucose),-1 + ((glucose), - - - [glucose),-1) 24-1) P] Ar2 This equation is valid for all annuli. To construct a concentration profile for the system, you will need to create a MATLAB code that solves equation 6 for each radial annuli using a loop. Solving the loop over a certain number of radial annuli will give you a diffusion profile along a radial slice for one point in time. You must then construct another loop to solve for the change in radial diffusion profile over time. You can assume the diffusion coefficient of glucose into the tissue (D) is 2.59 x 106 cm/s [1], and that you have an initial concentration of O just outside the capillary, and a uniform internal concentration of 7.8 mM. Assume the capillary is 10 um in diameter. You may neglect all source and sink terms in the equations above and model only the diffusion of glucose through the surrounding tissue. The program should generate two plots: A) A 3-dimensional surface plot describing the concentration profile of glucose as a function of time and a distance (from the center of the capillary). Using the 3-dimensional plot, determine the distance at which the tissue has 25% of the capillary glucose concentration after 1 minute. B) A linear plot describing the concentration profile of glucose from the edge of the capillary to half of the distance you found in part A
Step by Step Solution
There are 3 Steps involved in it

Get step-by-step solutions from verified subject matter experts