

Question: SOLVE WITH PYTHON SOLVE WITH PYTHON SOLVE WITH PYTHON SOLVE WITH PYTHON SOLVE WITH PYTHON SOLVE WITH PYTHON SOLVE WITH PYTHON SOLVE WITH PYTHON The
SOLVE WITH PYTHON
SOLVE WITH PYTHON SOLVE WITH PYTHON SOLVE WITH PYTHON SOLVE WITH PYTHON SOLVE WITH PYTHON SOLVE WITH PYTHON SOLVE WITH PYTHON
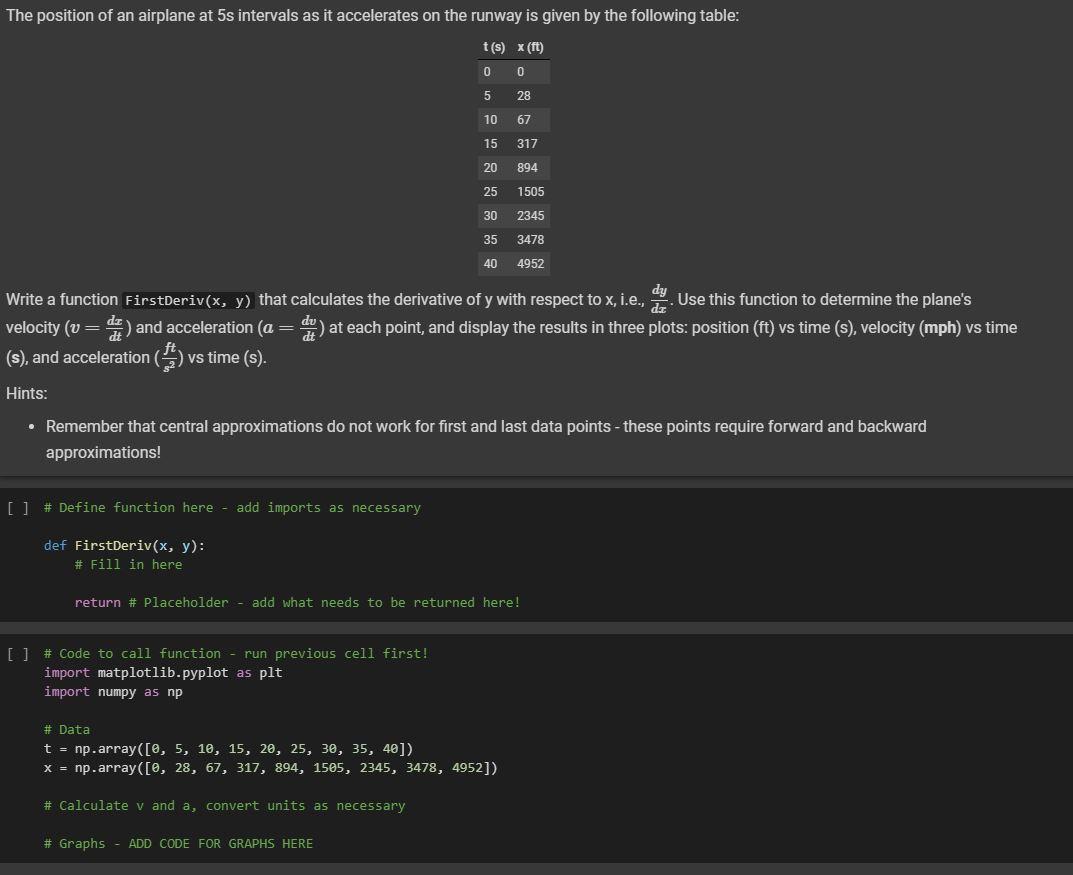
The position of an airplane at 5s intervals as it accelerates on the runway is given by the following table: t(s) x (ft) 0 0 5 28 10 67 15 317 20 894 25 1505 30 2345 35 3478 40 4952 = dit Write a function FirstDeriv(x, y) that calculates the derivative of y with respect to x, i.e., d. Use this function to determine the plane's velocity (v = ) and acceleration (a = d) at each point, and display the results in three plots: position (ft) vs time (s), velocity (mph) vs time (S), and acceleration () vs time (s). Hints: Remember that central approximations do not work for first and last data points - these points require forward and backward approximations! [] # Define function here - add imports as necessary def FirstDeriv(x, y): # Fill in here return # Placeholder - add what needs to be returned here! [ ] # code to call function - run previous cell first! import matplotlib.pyplot as plt import numpy as np # Data t = np.array([0, 5, 10, 15, 20, 25, 30, 35, 40]) x = np.array([0, 28, 67, 317, 894, 1505, 2345, 3478, 4952]) # Calculate v and a, convert units as necessary # Graphs - ADD CODE FOR GRAPHS HERE
Step by Step Solution
There are 3 Steps involved in it

Get step-by-step solutions from verified subject matter experts