

Question: Solve with the excel formula for anova please U O LL LU I The reading scores achieved by the participants in each group are as
Solve with the excel formula for anova please
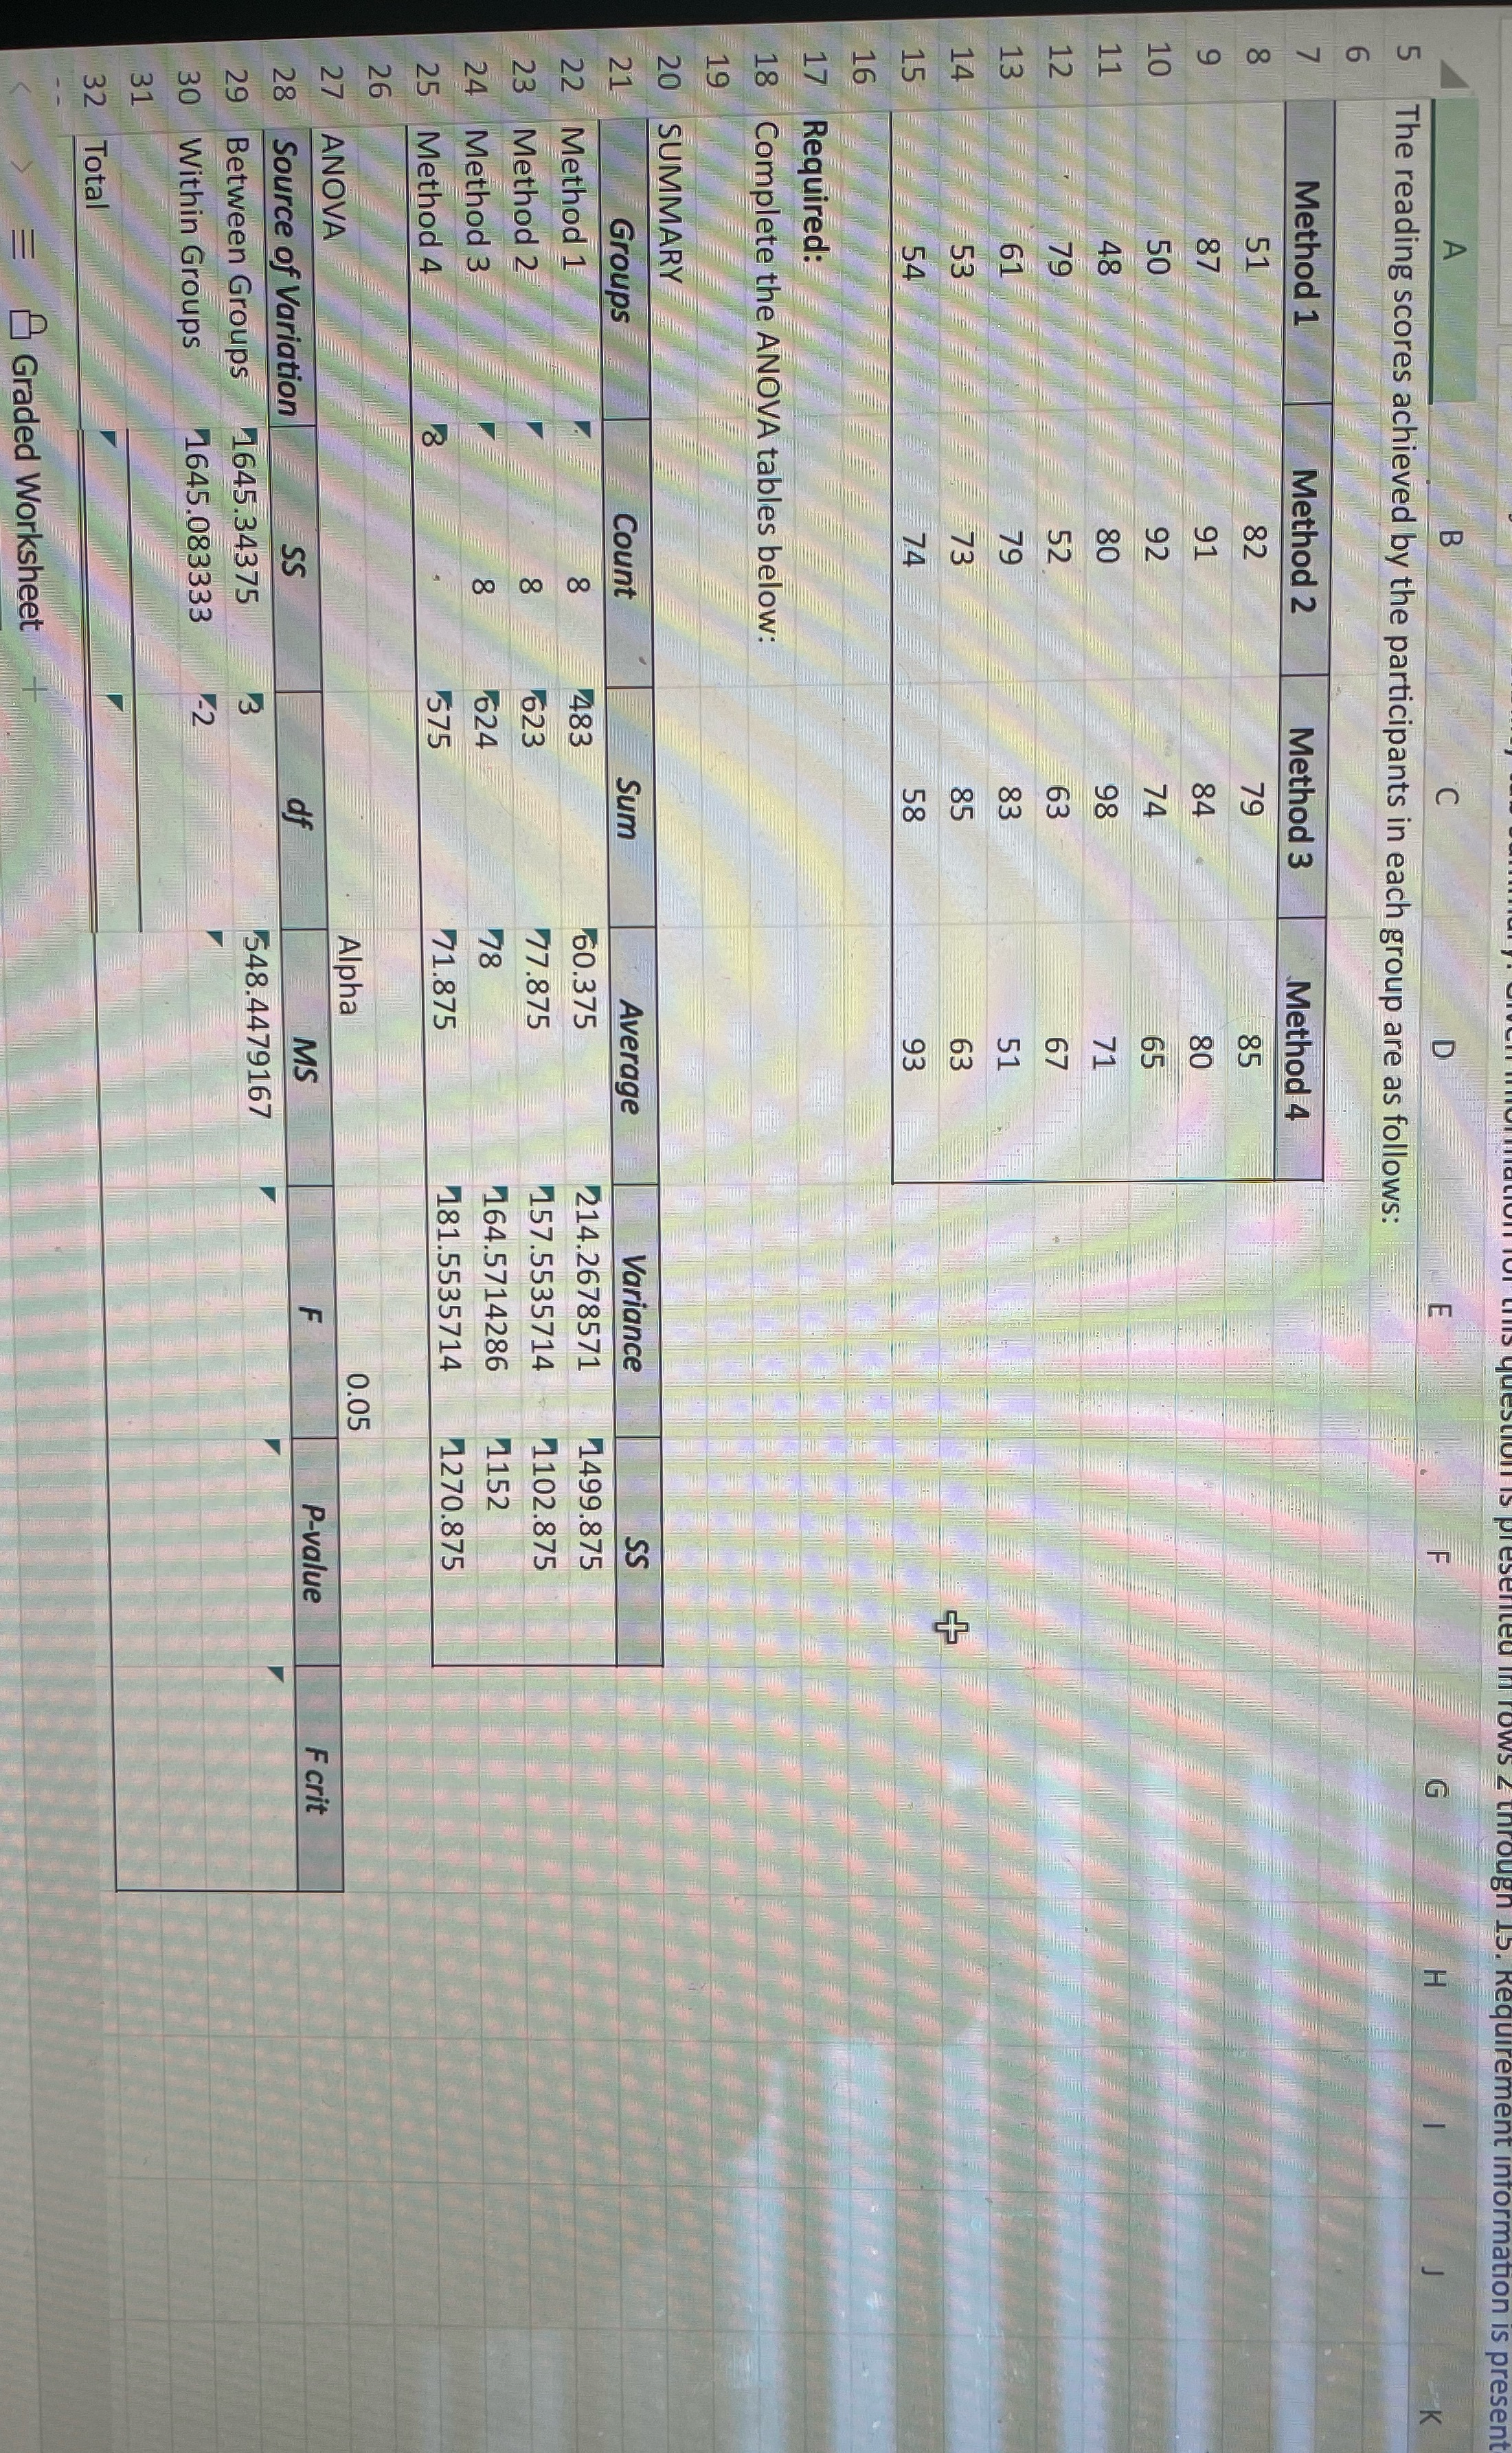
U O LL LU I The reading scores achieved by the participants in each group are as follows: Method 1 Method 2 Method 3 Method 4 + in Required: Complete the ANOVA tables below: SUMMARY Groups Count Sum Average Variance 2 Method 1 483 60.375 214.2678571 1499.875 m Method 2 623 77.875 157.5535714 1102.875 24 Method 3 624 78 164.5714286 1152 Method 4 575 71.875 181.5535714 1270.875 ANOVA Alpha 0.05 LL Source of Variation MS P-value F crit 29 Between Groups 1645.34375 548.4479167 MN 30 Within Groups 1645.083333 32 Total Graded Worksheet
Step by Step Solution
There are 3 Steps involved in it
1 Expert Approved Answer
Step: 1 Unlock

Question Has Been Solved by an Expert!
Get step-by-step solutions from verified subject matter experts
Step: 2 Unlock
Step: 3 Unlock