

Question: Solving using excel Consider the following information. Your portfolio is invested 30 percent each in A and C, and 40 percent in B. What is
Solving using excel
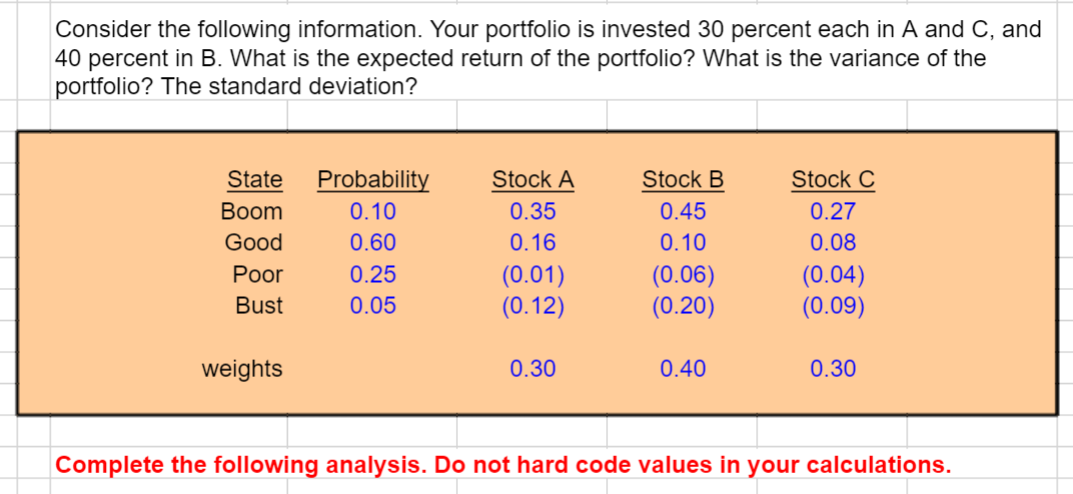
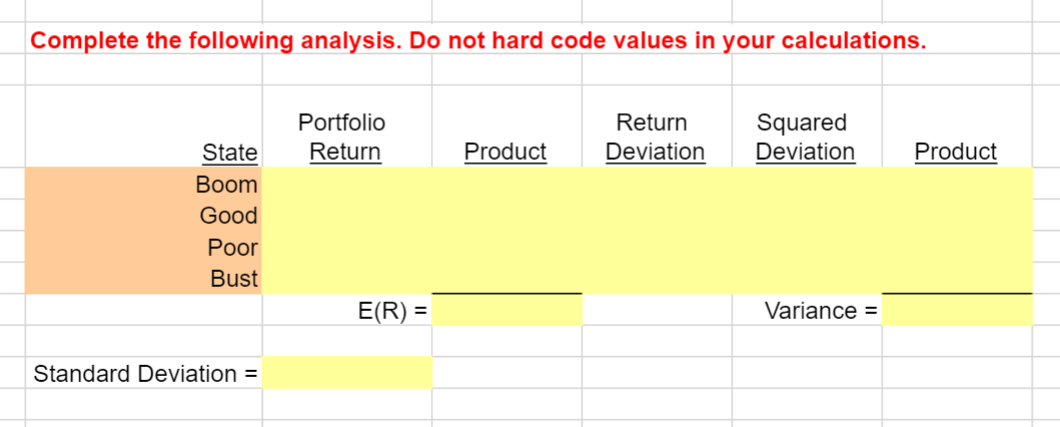
Consider the following information. Your portfolio is invested 30 percent each in A and C, and 40 percent in B. What is the expected return of the portfolio? What is the variance of the portfolio? The standard deviation? State Boom Good Poor Bust Probability 0.10 0.60 0.25 0.05 Stock A 0.35 0.16 (0.01) (0.12) Stock B 0.45 0.10 (0.06) (0.20) Stock C 0.27 0.08 (0.04) (0.09) weights 0.30 0.40 0.30 Complete the following analysis. Do not hard code values in your calculations. Complete the following analysis. Do not hard code values in your calculations. Portfolio Return Return Deviation Squared Deviation Product Product State Boom Good Poor Bust E(R) = Variance = Standard Deviation =
Step by Step Solution
There are 3 Steps involved in it

Get step-by-step solutions from verified subject matter experts