

Question: Some Analytical Steps that you may follow A. Write the objective of the case B. Write the problem statement of the case C. What are
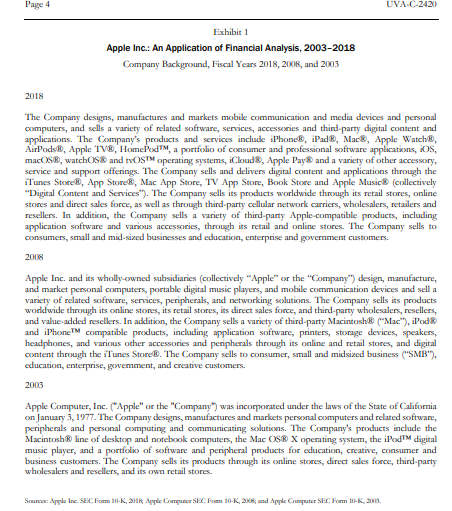
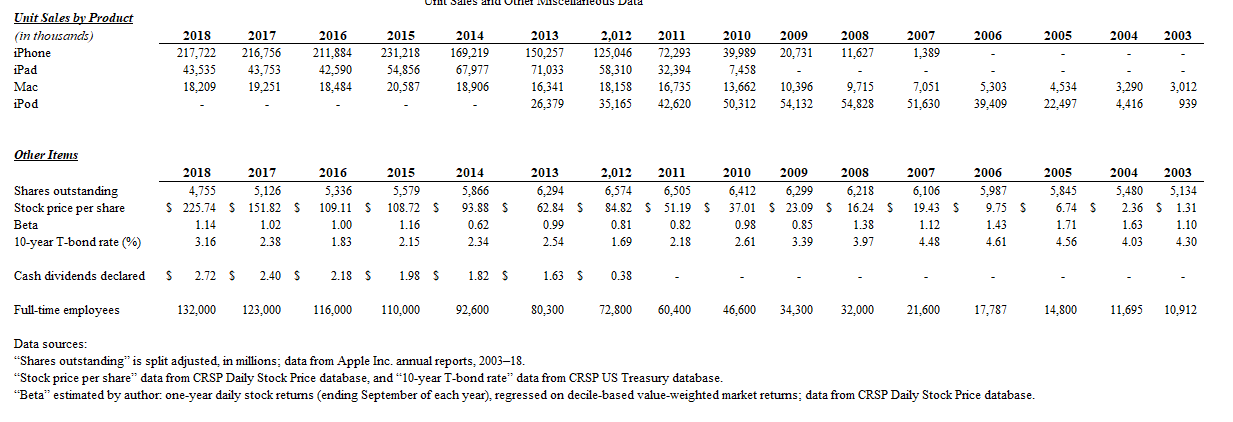
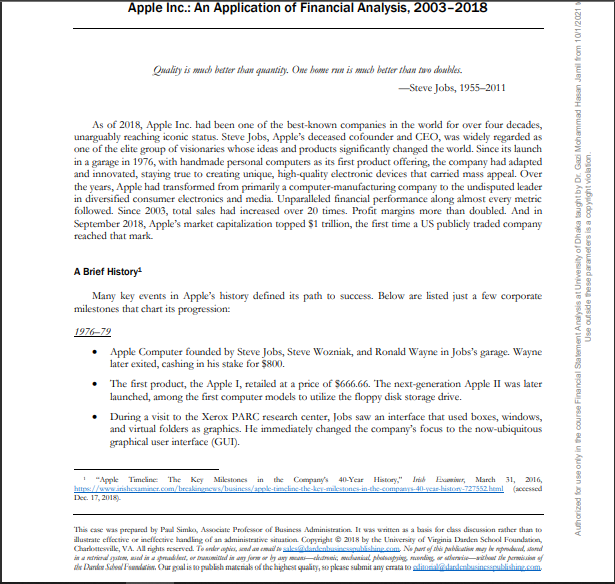
Some Analytical Steps that you may follow A. Write the objective of the case B. Write the problem statement of the case C. What are the differeni analytical techniques that you may follow to identify the problems and solutions to the problems? 2018 2017 2016 2015 2014 2013 2012 2011 2010 2009 2008 2007 2006 2005 2004 2003 1989 225 59531 10903 5340 -32590 -5322 826 9175 -44 29613 77434 276 150 33 20 48351 10157 4840 5966 -2093 -2723 9618 -626 -9892 63598 45687 53394 10505 11257 4210 3586 4938 1382 1095 611 -238 1791 5400 -1554 1042 -1065 4832 65824 81266 39510 7946 2863 2347 -4232 -76 5938 1460 3957 59713 Statements of Cash Flow (in millions of US dollars) Operating Activities Net income (loss) Depreciation & amortization Share-based compensation expense Deferred income tax expense (benefit) Accounts receivabla, net Inventorics Accounts payable Deferred revenue Net changes in other boats & liabilities Net cash flows from operating activities Investing Activities Purchases of securities & long-term investments Proceeds from sales of securities & investments Payments made in connection with business acq.. net Payment for acquisition of property, plant, & equipment Payment for acquisition of intangible assets Payments for strategic investments Other cash flow from investing activities Net cash flows from investing activities 37037 6757 2253 1141 -2172 -973 2340 1459 5824 53666 41733 3277 1740 4405 -5551 -15 4467 2824 -2024 50856 25922 1814 1168 2868 143 275 2515 1654 1170 37529 14013 1027 879 1440 -2142 -586 6307 1217 -3550 18595 217 3496 317 242 78 -385 -76 14.94 5704 703 710 -519 -939 54 92 6908 -2554 10159 4834 473 516 -368 -785 -163 596 5642 -1149 9536 1335 179 42 52 -121 -64 328 163 53 -357 -105 1611 69 113 16 -11 -201 -11 243 -45 297 304 5470 -1359 2220 784 2535 211 934 71 289 - 11736 9424 -7280 8352 - 11470 9195 -3270 1947 -2648 3607 -57811 -46825 -23003 46718 30678 16243 -638 -220 -2005 - 1144 -1091 - 116 -69 -108 -657 -260 -176 -71356 -2E+05 -1E+05 -2E.05-2E+05 -15.05 -2E.05 -1E+05 103719 126339 111794 121305 208111 124447 112805 69853 -721 -329 -297 -343 -3765 -4.96 -350 -244 -13313 -12451 -12734 - 11247 -9571 -8165 -8295 -4260 0 -344 -814 -241 -242 -911 -1107 -3132 -1518 -395 -1388 -745 220 -110 -26 16 -160 -48 -259 16066 -46446 -45977 -56274 - 22579 -33774 -48227 -40419 -164 -735 -251 -2 -13854 -74 -17434 -10 -8189 49 -3243 -58 357 -21 -2556 11 -1488 33 828 543 427 53 475 270 831 1133 -520 483 757 912 751 -406 365 377 627 318 361 407 665 1351 -1226 -2488 Financing Activities Proceeds from issuance of common stock Excess tax benefits from otock-based compensation Payments for taxes related to settlement of cquity award Payments for dividends & dividend equivalent paid Repurchases of common stock & other cquity Proceeds from issuance of term debt, net Payments of long-term debt Change in commercial paper, net Net cash flows from financing activities 669 555 495 543 730 530 0 749 739 701 -2527 -1874 - 1570 - 1499 -1158 -1082 -13712 -12769 - 12150 -11561 - 11126 -10564 -72738 -32900 -29722 -35253 -45000 -22860 6969 28662 24954 27114 11960 16896 -6500 -3500 -2500 -37 3852 -397 2191 6306 -87876 - 17347 -20483 -17716 -37549 -16379 -82 -124 3 -355 -26 -300 -1698 1444 1257 663 1116 739 324 543 127 27 Cash & cash equivalente, beginning of the year Increase (decrease) in cash & cash equivalents Cash & cash equivalents, end of the year 20289 20484 5624 -195 25913 20289 21120 -636 20404 13844 7276 21120 14259 -415 13844 10746 3513 14259 9815 931 10746 11261 -1446 9815 5263 5998 11261 11875 -6612 5263 9352 2523 11875 6392 2960 9352 3491 2901 6392 2969 522 3491 3336 -427 2969 2252 1144 3396 10444 Cash paid (received) for income taxes, net Cash paid during the year for interest 10417 3022 11591 2092 13252 514 10026 339 9128 0 7682 0 3338 0 2697 0 2997 0 1267 0 863 0 194 0 17 0 -7 10 45 20 1316 Page 4 UVA-C-2420 Exhibit 1 Apple Inc.: An Application of Financial Analysis, 2003-2018 Company Background, Fiscal Years 2018, 2018, and 2003 2018 The Company designs, manufactures and markets mobile communication and media devices and personal computers, and sells a variety of related software, services, accessories and third-party digital content and applications. The Company's products and services include iPhone, iPad, Mac, Apple Watch, AirPods, Apple TVE, HomePodTM, a portfolio of consumer and professional software applications, iOS, macOS, watchOS and IVOSTM operating systems, iCloud, Apple Pay and a variety of other accessory, service and support offerings. The Company sells and delivers digital content and applications through the iTunes Store, App Store, Mac App Store, TV App Store, Book Store and Apple Music (collectively "Digital Content and Services"). The Company sells its products worldwide through its retail stores, online stones and direct sales force, as well as through thirdparty cellular network carriers, wholesalers, retailers and resellers. In addition, the Company sells a variety of third-party Apple-compatible products, including application software and various accessories, through its retail and online stores. The Company sells to consumers, small and mid-sized businesses and education, enterprise and government customers. 2008 Apple Inc. and its wholly-owned subsidiaries (collectively "Apple" or the "Company") design, manufacture, and market personal computers, portable digital music players, and mobile communication devices and sell a variety of related software, services, peripherals, and networking solutions. The Company sells its products worldwide through its online stores, its retail stores, its direct sales force, and third-party wholesalers, resellers, and value-added resellers. In addition, the Company sells a variety of third-party Macintosh ("Mac"), iPod and iPhone compatible products, including application software, printers, storage devices, speakers, headphones, and various other accessories and peripherals through its online and retail stores, and digital content through the iTunes Store. The Company sells to consumer, small and midsized business ("SMS"), education, enterprise, govemment, and creative customers. 2003 Apple Computer, Inc. ("Apple" or the "Company") was incorporated under the laws of the State of California on January 3, 1977. The Company designs, manufactures and markets personal computers and related software, peripherals and personal computing and communicating solutions. The Company's products include the Macintosh line of desktop and notebook computers, the Mac OS X operating system, the iPodTM digital music player, and a portfolio of software and peripheral products for education, creative, consumer and business customers. The Company sells its products through its online stores, direct sales force, third-party wholesalers and resellers, and its own retail stores. Source: Apple Inc. SEC Form 10-K, 21 Apple Computer SEC Foen 10-K, 2 and Apple Computer SEC Form 10-K, 23. 776 Balance Sheets (in millions of US dollars) Cash & cash equivalents Short-term marketable securities Accounts receivable.net Inventories Deferred tax assets Vendor nontrade receivables Other current assets Total current assets Long-term marketable securities Gross property, plant, & equipment Accumulated depreciation & amortization Other noncurrent assets Total assets 2018 2017 2016 2015 2014 2013 2012 2011 2010 2009 2008 2007 2006 2005 25,913 2004 20,289 2003 20,484 21,120 13,844 14,259 10.746 9,815 11,261 5,263 11,875 9,352 3,491 40,388 6,392 2.969 53,892 3,396 46,671 20,481 11,233 26,287 18.383 16,137 14,359 18,201 12,615 6,034 3,718 4,770 23,186 17,874 2.495 1,170 15,754 16.849 17,460 13,102 10.930 5,369 5.510 3,361 2,422 1,637 1.252 895 774 766 3,956 4,855 2,132 2,349 2,111 1,764 791 1,051 455 509 346 270 165 101 56 5,546 4,318 3,453 2,583 2,014 1,636 2,101 1,447 782 607 231 25,809 331 190 17,799 13,545 13,494 9,759 7,539 7,762 6,348 4,414 1.696 2.282 2,392 1,593 417 276 12,087 13,936 8.283 9,539 9,806 6.882 6,458 4,529 3,447 5,188 3,540 1,413 677 231 209 309 131,339 128,645 106,869 89,378 68,531 73,286 57,653 44,988 41,678 36,265 34,690 21,956 14,509 10,300 7,055 5,887 170,799 194.714 170,430 164,065 130,162 106,215 92.122 55,618 25,391 10,528 90,403 75,076 61,245 49,257 39,015 28,519 21,887 11,768 7,234 4,667 3,747 2,841 2,075 1,481 1,298 (49,099) (41,293) (34,235) (26,786) (18,391) (11,922) 1,174 (6.435) (3,991) (2.466) (1,713) (1,292) (1,009) (664) 22,283 18,177 (591) (505) 17,377 14,565 12,522 10,902 10,837 7,988 3,346 4,104 2,427 1,559 1,415 434 288 259 365,725 375,319 321,686 290,479 231,839 207,000 176,064 116,371 75,183 53,851 39,572 25,347 17,205 11,551 8,050 6,815 55,888 44,242 37,294 35,490 30.196 22,367 21,175 14.632 12,015 5,601 5,520 4.970 3,390 1,451 32,687 30,551 1,779 22.027 1,154 25,181 18,453 13.856 11,414 9,247 5,723 3,376 8,572 4,329 3,081 1,705 1,229 899 7,543 7.548 8,080 8.940 8,491 7,435 5,953 4,091 2,984 10,305 11,964 11.977 8,103 8,499 6,308 8,784 6,496 3,500 2,500 304 116,866 100,814 79,006 80,610 63,448 43,658 38,542 27,970 20,722 19,282 14,092 9,299 6,471 2,797 3,484 2,680 2,357 2,836 2.930 3,624 3,031 2,625 2,648 1,686 1,139 4,485 3,029 830 355 281 294 235 (194) Accounts payable Accrued expenses Deferred revenue Commercial paper Current portion of long-term debt Total current liabilities Deferred revenuenoncurrent 2018 Net Sales by Segment (in millions of US dollars) Americas Europe Greater China Japan Rest of Asia Pacific Retail Other segments Total Net Sales 2004 2003 4,019 S 3,181 1,799 1,309 2017 2016 2015 2014 2013 2,012 $ 112,093 S 96,600 $ 86,613 S 93,864 $ 65,232 $ 62,739 S 57,512 S 62,420 54,938 49,952 50,337 40,929 37,883 36,323 51,942 44.764 48.492 58,715 29,846 25,417 22,533 21,733 17.733 16,928 15,706 14,982 13.462 10,571 17,407 15,199 13,654 15,093 10,344 11,181 10,741 n/a n/a n/a 21,462 20,228 18.828 n/a n/a n/a n/a /a n/a n/a $ 265,595 $ 229,234 $215,639 $ 233,715 ****** $ 170,910 $156,508 $ 2011 38,315 5 27,778 12,690 5,437 9,902 14,127 n/a na 108,249 $ 2010 24,498 $ 18,692 n/a 3,981 8,256 9,798 n/a 65,225$ 2009 16,142 $ 9,365 n/a 1,831 n/a 6,574 2.625 36,537 $ 2008 14,573 $ 7,622 n/a 1,509 n/a 6,315 2.460 32,479 $ 2007 11,596 S 5,460 n/a 1,082 2006 9,415 5 S 4,096 n/a 1,211 n/a 3,246 1,347 19,315 $ 2005 6,590 $ 3,073 / n/a 920 n/a 2.350 998 13,931 $ 4,115 1,753 24,006 $ 677 698 n/a n/a 1,185 621 599 398 8,279 $ 6,207 $ 2006 2009 6,754 $ 2008 1.844 $ 2007 123 Net Sales by Product (in millions of US dollars) iPhone iPad Mac iPod Services Other products Accessories Total Net Sales 2018 2017 2016 2015 $ 166,699 $ 141,319 $136,700 $ 155,041 18,805 19,222 20,628 23,227 25,484 25,850 22,831 25,471 2014 2013 2,012 ## $ 91,279 $ 91,279 $ 78,692 $ 30,283 31,980 30,945 24.079 21,483 23,221 4,411 5,615 18.063 16,051 8,379 5.706 5,145 ******* $ 170,910 $156,508'S 2011 45,998 $ 19,168 21,783 7.453 9,373 2010 25,179 $ 4.958 17,479 8,274 2,573 4.948 1.814 65.225$ 12,890 37,190 17,417 2005 - - 6,275 4,540 1,091 899 1,126 13,931 '$ 29,980 12,863 2004 2003 . - - 4.923 4.491 1,306 345 821 644 278 36 951 691 8,279 '$ 6,207 13,780 8,091 2,406 4,036 1.470 36,537 S 24,348 11,132 14,276 9,153 2.207 3,340 1.659 32,479 19,909 10,067 10,314 8,305 1,508 2,496 1.260 24,006 '$ 7,375 7,676 1,279 1,885 1.100 19,315 '$ $ 265,595 $ 229,234 $215,639 233,715 4.474 108,249 $ Data sources: Apple Inc. SEC Form 10-K filings and annual reports, 200318. JIAL Sales Sales and Vascendreous Data 2006 2005 2004 2003 2009 20,731 2008 11,627 2007 1.389 Unit Sales by Product (in thousands) iPhone iPad Mac iPod 2018 217,722 43,535 18,209 2017 216,756 43,753 19,251 2016 211,884 42,590 18,484 2015 231,218 54,856 20,587 2014 169,219 67,977 18,906 2013 150,257 71,033 16,341 26,379 2,012 125,046 58,310 18,158 35,165 2011 72,293 32,394 16.735 42.620 2010 39,989 7,458 13,662 50,312 10,396 54,132 9,715 54,828 7,051 51,630 5,303 39.409 4,534 22,497 3,290 4,416 3,012 939 Other Items Shares outstanding Stock price per share Beta 10-year T-bond rate %) 2018 2017 4.755 5,126 $ 225.74 $ 151.82 $ 1.14 1.02 3.16 2.38 2016 2015 5,336 5,579 109.11 $ 108.72 S 1.00 1.16 1.83 2.15 2014 5,866 93.88 $ 0.62 2.34 2013 6,294 62.84 S 0.99 2.54 2,012 2011 6,574 6.505 84.82 $ 51.19 S 0.81 0.82 1.69 2.18 2010 2009 6,412 6.299 37.01 S 23.09 $ 0.98 0.85 2.61 3.39 2008 6,218 16.24 $ 1.38 3.97 2007 6,106 19.43S 1.12 4.48 2006 5,987 9.75 $ 1.43 4.61 2005 5,845 6.74 $ 1.71 4.56 2004 2003 5,480 5,134 2.36 $ 1.31 1.63 1.10 4.03 4.30 Cash dividends declared $ S 2.72 S 2.40 $ 2.18 $ 1.98 S 1.82 $ 1.63 S 0.38 - Full-time employees 132,000 123,000 116,000 110,000 92,600 80,300 72,800 60,400 46,600 34,300 32,000 21,600 17,787 14,800 11,695 10,912 Data sources: **Shares outstanding" is split adjusted in millions; data from Apple Inc. annual reports, 200318. "Stock price per share" data from CRSP Daily Stock Price database, and "10-year T-bond rate data from CRSP US Treasury database. *Beta" estimated by author one-year daily stock retums (ending September of each year), regressed on decile-based value-weighted market retums: data from CRSP Daily Stock Price database. Apple Inc.: An Application of Financial Analysis, 2003-2018 Quality is much better than quantity. One bronne raun is souch better than too dumbles. -Steve Jobs, 1955-2011 As of 2018, Apple Inc. had been one of the best-known companies in the world for over four decades, unarguably reaching iconic status. Steve Jobs, Apple's deceased cofounder and CEO, was widely regarded as one of the elite group of visionaries whose ideas and products significantly changed the world. Since its launch in a garage in 1976, with handmade personal computers as its first product offering the company had adapted and innovated, staying true to creating unique, high-quality electronic devices that carried mass appeal. Over the years, Apple had transformed from primarily a computer-manufacturing company to the undisputed leader in diversified consumer electronics and media. Unparalleled financial performance along almost every metric followed. Since 2003, total sales had increased over 20 times. Profit margins more than doubled. And in September 2018, Apple's market capitalization topped $1 trillion, the first time a US publicly traded company reached that mark A Brief History Many key events in Apple's history defined its path to success. Below are listed just a few corporate milestones that chart its progression: 197679 Apple Computer founded by Steve Jobs, Steve Wozniak, and Ronald Wayne in Jobs's garage. Wayne later exited, cashing in his stake for $800. The first product, the Apple I, retailed at a price of $666.66. The next-generation Apple II was later launched, among the first computer models to utilize the floppy disk storage drive. . During a visit to the Xerox PARC research center, Jobs saw an interface that used boxes, windows, and virtual folders as graphics. He immediately changed the company's focus to the now-ubiquitous graphical user interface (GUI). Aumorized for use only in the course Financial Statement Analysis at University of Dhaka taught by Dr. Gazi Mohammad Hasan Jamil from 10/1/2021 Use outside these parameters is a copyright violation Apple Timeline The Key Milestones in the Company's 40-Year History," Trail Excis, March 31, 2016, https://www.inshexaminer.com/breakingnews/business/apple-tamchine-the-key-milestone-in-the-company-40-year-history-727552 ml (accessed Dec. 17, 2018) This case was prepared by Paul Simba, Associate Profesor of Business Administrate. It was written as a basis for class discussion rather than to illustrate effective or effective handling of an administrative situation. Copyright 2018 by the Universary of Virpinia Darden School Foundation, Charlotte, VA. All rights reserved. Tundide sales andere malishing.com News of the powy be reprendred ', tr a giridant, raitin ar --, malarin aaye, morality - Diarie-silent as hurai die lande Scea Funda. Qural is to probabiesh matemabod the highest quality, please submit any crtata to aliomalia dardenbusinesspullishin.com, Some Analytical Steps that you may follow A. Write the objective of the case B. Write the problem statement of the case C. What are the differeni analytical techniques that you may follow to identify the problems and solutions to the problems? 2018 2017 2016 2015 2014 2013 2012 2011 2010 2009 2008 2007 2006 2005 2004 2003 1989 225 59531 10903 5340 -32590 -5322 826 9175 -44 29613 77434 276 150 33 20 48351 10157 4840 5966 -2093 -2723 9618 -626 -9892 63598 45687 53394 10505 11257 4210 3586 4938 1382 1095 611 -238 1791 5400 -1554 1042 -1065 4832 65824 81266 39510 7946 2863 2347 -4232 -76 5938 1460 3957 59713 Statements of Cash Flow (in millions of US dollars) Operating Activities Net income (loss) Depreciation & amortization Share-based compensation expense Deferred income tax expense (benefit) Accounts receivabla, net Inventorics Accounts payable Deferred revenue Net changes in other boats & liabilities Net cash flows from operating activities Investing Activities Purchases of securities & long-term investments Proceeds from sales of securities & investments Payments made in connection with business acq.. net Payment for acquisition of property, plant, & equipment Payment for acquisition of intangible assets Payments for strategic investments Other cash flow from investing activities Net cash flows from investing activities 37037 6757 2253 1141 -2172 -973 2340 1459 5824 53666 41733 3277 1740 4405 -5551 -15 4467 2824 -2024 50856 25922 1814 1168 2868 143 275 2515 1654 1170 37529 14013 1027 879 1440 -2142 -586 6307 1217 -3550 18595 217 3496 317 242 78 -385 -76 14.94 5704 703 710 -519 -939 54 92 6908 -2554 10159 4834 473 516 -368 -785 -163 596 5642 -1149 9536 1335 179 42 52 -121 -64 328 163 53 -357 -105 1611 69 113 16 -11 -201 -11 243 -45 297 304 5470 -1359 2220 784 2535 211 934 71 289 - 11736 9424 -7280 8352 - 11470 9195 -3270 1947 -2648 3607 -57811 -46825 -23003 46718 30678 16243 -638 -220 -2005 - 1144 -1091 - 116 -69 -108 -657 -260 -176 -71356 -2E+05 -1E+05 -2E.05-2E+05 -15.05 -2E.05 -1E+05 103719 126339 111794 121305 208111 124447 112805 69853 -721 -329 -297 -343 -3765 -4.96 -350 -244 -13313 -12451 -12734 - 11247 -9571 -8165 -8295 -4260 0 -344 -814 -241 -242 -911 -1107 -3132 -1518 -395 -1388 -745 220 -110 -26 16 -160 -48 -259 16066 -46446 -45977 -56274 - 22579 -33774 -48227 -40419 -164 -735 -251 -2 -13854 -74 -17434 -10 -8189 49 -3243 -58 357 -21 -2556 11 -1488 33 828 543 427 53 475 270 831 1133 -520 483 757 912 751 -406 365 377 627 318 361 407 665 1351 -1226 -2488 Financing Activities Proceeds from issuance of common stock Excess tax benefits from otock-based compensation Payments for taxes related to settlement of cquity award Payments for dividends & dividend equivalent paid Repurchases of common stock & other cquity Proceeds from issuance of term debt, net Payments of long-term debt Change in commercial paper, net Net cash flows from financing activities 669 555 495 543 730 530 0 749 739 701 -2527 -1874 - 1570 - 1499 -1158 -1082 -13712 -12769 - 12150 -11561 - 11126 -10564 -72738 -32900 -29722 -35253 -45000 -22860 6969 28662 24954 27114 11960 16896 -6500 -3500 -2500 -37 3852 -397 2191 6306 -87876 - 17347 -20483 -17716 -37549 -16379 -82 -124 3 -355 -26 -300 -1698 1444 1257 663 1116 739 324 543 127 27 Cash & cash equivalente, beginning of the year Increase (decrease) in cash & cash equivalents Cash & cash equivalents, end of the year 20289 20484 5624 -195 25913 20289 21120 -636 20404 13844 7276 21120 14259 -415 13844 10746 3513 14259 9815 931 10746 11261 -1446 9815 5263 5998 11261 11875 -6612 5263 9352 2523 11875 6392 2960 9352 3491 2901 6392 2969 522 3491 3336 -427 2969 2252 1144 3396 10444 Cash paid (received) for income taxes, net Cash paid during the year for interest 10417 3022 11591 2092 13252 514 10026 339 9128 0 7682 0 3338 0 2697 0 2997 0 1267 0 863 0 194 0 17 0 -7 10 45 20 1316 Page 4 UVA-C-2420 Exhibit 1 Apple Inc.: An Application of Financial Analysis, 2003-2018 Company Background, Fiscal Years 2018, 2018, and 2003 2018 The Company designs, manufactures and markets mobile communication and media devices and personal computers, and sells a variety of related software, services, accessories and third-party digital content and applications. The Company's products and services include iPhone, iPad, Mac, Apple Watch, AirPods, Apple TVE, HomePodTM, a portfolio of consumer and professional software applications, iOS, macOS, watchOS and IVOSTM operating systems, iCloud, Apple Pay and a variety of other accessory, service and support offerings. The Company sells and delivers digital content and applications through the iTunes Store, App Store, Mac App Store, TV App Store, Book Store and Apple Music (collectively "Digital Content and Services"). The Company sells its products worldwide through its retail stores, online stones and direct sales force, as well as through thirdparty cellular network carriers, wholesalers, retailers and resellers. In addition, the Company sells a variety of third-party Apple-compatible products, including application software and various accessories, through its retail and online stores. The Company sells to consumers, small and mid-sized businesses and education, enterprise and government customers. 2008 Apple Inc. and its wholly-owned subsidiaries (collectively "Apple" or the "Company") design, manufacture, and market personal computers, portable digital music players, and mobile communication devices and sell a variety of related software, services, peripherals, and networking solutions. The Company sells its products worldwide through its online stores, its retail stores, its direct sales force, and third-party wholesalers, resellers, and value-added resellers. In addition, the Company sells a variety of third-party Macintosh ("Mac"), iPod and iPhone compatible products, including application software, printers, storage devices, speakers, headphones, and various other accessories and peripherals through its online and retail stores, and digital content through the iTunes Store. The Company sells to consumer, small and midsized business ("SMS"), education, enterprise, govemment, and creative customers. 2003 Apple Computer, Inc. ("Apple" or the "Company") was incorporated under the laws of the State of California on January 3, 1977. The Company designs, manufactures and markets personal computers and related software, peripherals and personal computing and communicating solutions. The Company's products include the Macintosh line of desktop and notebook computers, the Mac OS X operating system, the iPodTM digital music player, and a portfolio of software and peripheral products for education, creative, consumer and business customers. The Company sells its products through its online stores, direct sales force, third-party wholesalers and resellers, and its own retail stores. Source: Apple Inc. SEC Form 10-K, 21 Apple Computer SEC Foen 10-K, 2 and Apple Computer SEC Form 10-K, 23. 776 Balance Sheets (in millions of US dollars) Cash & cash equivalents Short-term marketable securities Accounts receivable.net Inventories Deferred tax assets Vendor nontrade receivables Other current assets Total current assets Long-term marketable securities Gross property, plant, & equipment Accumulated depreciation & amortization Other noncurrent assets Total assets 2018 2017 2016 2015 2014 2013 2012 2011 2010 2009 2008 2007 2006 2005 25,913 2004 20,289 2003 20,484 21,120 13,844 14,259 10.746 9,815 11,261 5,263 11,875 9,352 3,491 40,388 6,392 2.969 53,892 3,396 46,671 20,481 11,233 26,287 18.383 16,137 14,359 18,201 12,615 6,034 3,718 4,770 23,186 17,874 2.495 1,170 15,754 16.849 17,460 13,102 10.930 5,369 5.510 3,361 2,422 1,637 1.252 895 774 766 3,956 4,855 2,132 2,349 2,111 1,764 791 1,051 455 509 346 270 165 101 56 5,546 4,318 3,453 2,583 2,014 1,636 2,101 1,447 782 607 231 25,809 331 190 17,799 13,545 13,494 9,759 7,539 7,762 6,348 4,414 1.696 2.282 2,392 1,593 417 276 12,087 13,936 8.283 9,539 9,806 6.882 6,458 4,529 3,447 5,188 3,540 1,413 677 231 209 309 131,339 128,645 106,869 89,378 68,531 73,286 57,653 44,988 41,678 36,265 34,690 21,956 14,509 10,300 7,055 5,887 170,799 194.714 170,430 164,065 130,162 106,215 92.122 55,618 25,391 10,528 90,403 75,076 61,245 49,257 39,015 28,519 21,887 11,768 7,234 4,667 3,747 2,841 2,075 1,481 1,298 (49,099) (41,293) (34,235) (26,786) (18,391) (11,922) 1,174 (6.435) (3,991) (2.466) (1,713) (1,292) (1,009) (664) 22,283 18,177 (591) (505) 17,377 14,565 12,522 10,902 10,837 7,988 3,346 4,104 2,427 1,559 1,415 434 288 259 365,725 375,319 321,686 290,479 231,839 207,000 176,064 116,371 75,183 53,851 39,572 25,347 17,205 11,551 8,050 6,815 55,888 44,242 37,294 35,490 30.196 22,367 21,175 14.632 12,015 5,601 5,520 4.970 3,390 1,451 32,687 30,551 1,779 22.027 1,154 25,181 18,453 13.856 11,414 9,247 5,723 3,376 8,572 4,329 3,081 1,705 1,229 899 7,543 7.548 8,080 8.940 8,491 7,435 5,953 4,091 2,984 10,305 11,964 11.977 8,103 8,499 6,308 8,784 6,496 3,500 2,500 304 116,866 100,814 79,006 80,610 63,448 43,658 38,542 27,970 20,722 19,282 14,092 9,299 6,471 2,797 3,484 2,680 2,357 2,836 2.930 3,624 3,031 2,625 2,648 1,686 1,139 4,485 3,029 830 355 281 294 235 (194) Accounts payable Accrued expenses Deferred revenue Commercial paper Current portion of long-term debt Total current liabilities Deferred revenuenoncurrent 2018 Net Sales by Segment (in millions of US dollars) Americas Europe Greater China Japan Rest of Asia Pacific Retail Other segments Total Net Sales 2004 2003 4,019 S 3,181 1,799 1,309 2017 2016 2015 2014 2013 2,012 $ 112,093 S 96,600 $ 86,613 S 93,864 $ 65,232 $ 62,739 S 57,512 S 62,420 54,938 49,952 50,337 40,929 37,883 36,323 51,942 44.764 48.492 58,715 29,846 25,417 22,533 21,733 17.733 16,928 15,706 14,982 13.462 10,571 17,407 15,199 13,654 15,093 10,344 11,181 10,741 n/a n/a n/a 21,462 20,228 18.828 n/a n/a n/a n/a /a n/a n/a $ 265,595 $ 229,234 $215,639 $ 233,715 ****** $ 170,910 $156,508 $ 2011 38,315 5 27,778 12,690 5,437 9,902 14,127 n/a na 108,249 $ 2010 24,498 $ 18,692 n/a 3,981 8,256 9,798 n/a 65,225$ 2009 16,142 $ 9,365 n/a 1,831 n/a 6,574 2.625 36,537 $ 2008 14,573 $ 7,622 n/a 1,509 n/a 6,315 2.460 32,479 $ 2007 11,596 S 5,460 n/a 1,082 2006 9,415 5 S 4,096 n/a 1,211 n/a 3,246 1,347 19,315 $ 2005 6,590 $ 3,073 / n/a 920 n/a 2.350 998 13,931 $ 4,115 1,753 24,006 $ 677 698 n/a n/a 1,185 621 599 398 8,279 $ 6,207 $ 2006 2009 6,754 $ 2008 1.844 $ 2007 123 Net Sales by Product (in millions of US dollars) iPhone iPad Mac iPod Services Other products Accessories Total Net Sales 2018 2017 2016 2015 $ 166,699 $ 141,319 $136,700 $ 155,041 18,805 19,222 20,628 23,227 25,484 25,850 22,831 25,471 2014 2013 2,012 ## $ 91,279 $ 91,279 $ 78,692 $ 30,283 31,980 30,945 24.079 21,483 23,221 4,411 5,615 18.063 16,051 8,379 5.706 5,145 ******* $ 170,910 $156,508'S 2011 45,998 $ 19,168 21,783 7.453 9,373 2010 25,179 $ 4.958 17,479 8,274 2,573 4.948 1.814 65.225$ 12,890 37,190 17,417 2005 - - 6,275 4,540 1,091 899 1,126 13,931 '$ 29,980 12,863 2004 2003 . - - 4.923 4.491 1,306 345 821 644 278 36 951 691 8,279 '$ 6,207 13,780 8,091 2,406 4,036 1.470 36,537 S 24,348 11,132 14,276 9,153 2.207 3,340 1.659 32,479 19,909 10,067 10,314 8,305 1,508 2,496 1.260 24,006 '$ 7,375 7,676 1,279 1,885 1.100 19,315 '$ $ 265,595 $ 229,234 $215,639 233,715 4.474 108,249 $ Data sources: Apple Inc. SEC Form 10-K filings and annual reports, 200318. JIAL Sales Sales and Vascendreous Data 2006 2005 2004 2003 2009 20,731 2008 11,627 2007 1.389 Unit Sales by Product (in thousands) iPhone iPad Mac iPod 2018 217,722 43,535 18,209 2017 216,756 43,753 19,251 2016 211,884 42,590 18,484 2015 231,218 54,856 20,587 2014 169,219 67,977 18,906 2013 150,257 71,033 16,341 26,379 2,012 125,046 58,310 18,158 35,165 2011 72,293 32,394 16.735 42.620 2010 39,989 7,458 13,662 50,312 10,396 54,132 9,715 54,828 7,051 51,630 5,303 39.409 4,534 22,497 3,290 4,416 3,012 939 Other Items Shares outstanding Stock price per share Beta 10-year T-bond rate %) 2018 2017 4.755 5,126 $ 225.74 $ 151.82 $ 1.14 1.02 3.16 2.38 2016 2015 5,336 5,579 109.11 $ 108.72 S 1.00 1.16 1.83 2.15 2014 5,866 93.88 $ 0.62 2.34 2013 6,294 62.84 S 0.99 2.54 2,012 2011 6,574 6.505 84.82 $ 51.19 S 0.81 0.82 1.69 2.18 2010 2009 6,412 6.299 37.01 S 23.09 $ 0.98 0.85 2.61 3.39 2008 6,218 16.24 $ 1.38 3.97 2007 6,106 19.43S 1.12 4.48 2006 5,987 9.75 $ 1.43 4.61 2005 5,845 6.74 $ 1.71 4.56 2004 2003 5,480 5,134 2.36 $ 1.31 1.63 1.10 4.03 4.30 Cash dividends declared $ S 2.72 S 2.40 $ 2.18 $ 1.98 S 1.82 $ 1.63 S 0.38 - Full-time employees 132,000 123,000 116,000 110,000 92,600 80,300 72,800 60,400 46,600 34,300 32,000 21,600 17,787 14,800 11,695 10,912 Data sources: **Shares outstanding" is split adjusted in millions; data from Apple Inc. annual reports, 200318. "Stock price per share" data from CRSP Daily Stock Price database, and "10-year T-bond rate data from CRSP US Treasury database. *Beta" estimated by author one-year daily stock retums (ending September of each year), regressed on decile-based value-weighted market retums: data from CRSP Daily Stock Price database. Apple Inc.: An Application of Financial Analysis, 2003-2018 Quality is much better than quantity. One bronne raun is souch better than too dumbles. -Steve Jobs, 1955-2011 As of 2018, Apple Inc. had been one of the best-known companies in the world for over four decades, unarguably reaching iconic status. Steve Jobs, Apple's deceased cofounder and CEO, was widely regarded as one of the elite group of visionaries whose ideas and products significantly changed the world. Since its launch in a garage in 1976, with handmade personal computers as its first product offering the company had adapted and innovated, staying true to creating unique, high-quality electronic devices that carried mass appeal. Over the years, Apple had transformed from primarily a computer-manufacturing company to the undisputed leader in diversified consumer electronics and media. Unparalleled financial performance along almost every metric followed. Since 2003, total sales had increased over 20 times. Profit margins more than doubled. And in September 2018, Apple's market capitalization topped $1 trillion, the first time a US publicly traded company reached that mark A Brief History Many key events in Apple's history defined its path to success. Below are listed just a few corporate milestones that chart its progression: 197679 Apple Computer founded by Steve Jobs, Steve Wozniak, and Ronald Wayne in Jobs's garage. Wayne later exited, cashing in his stake for $800. The first product, the Apple I, retailed at a price of $666.66. The next-generation Apple II was later launched, among the first computer models to utilize the floppy disk storage drive. . During a visit to the Xerox PARC research center, Jobs saw an interface that used boxes, windows, and virtual folders as graphics. He immediately changed the company's focus to the now-ubiquitous graphical user interface (GUI). Aumorized for use only in the course Financial Statement Analysis at University of Dhaka taught by Dr. Gazi Mohammad Hasan Jamil from 10/1/2021 Use outside these parameters is a copyright violation Apple Timeline The Key Milestones in the Company's 40-Year History," Trail Excis, March 31, 2016, https://www.inshexaminer.com/breakingnews/business/apple-tamchine-the-key-milestone-in-the-company-40-year-history-727552 ml (accessed Dec. 17, 2018) This case was prepared by Paul Simba, Associate Profesor of Business Administrate. It was written as a basis for class discussion rather than to illustrate effective or effective handling of an administrative situation. Copyright 2018 by the Universary of Virpinia Darden School Foundation, Charlotte, VA. All rights reserved. Tundide sales andere malishing.com News of the powy be reprendred ', tr a giridant, raitin ar --, malarin aaye, morality - Diarie-silent as hurai die lande Scea Funda. Qural is to probabiesh matemabod the highest quality, please submit any crtata to aliomalia dardenbusinesspullishin.com
Step by Step Solution
There are 3 Steps involved in it

Get step-by-step solutions from verified subject matter experts