

Question: Some data sets include values so high or so low that they seem to stand apart from the rest of the data. These data are
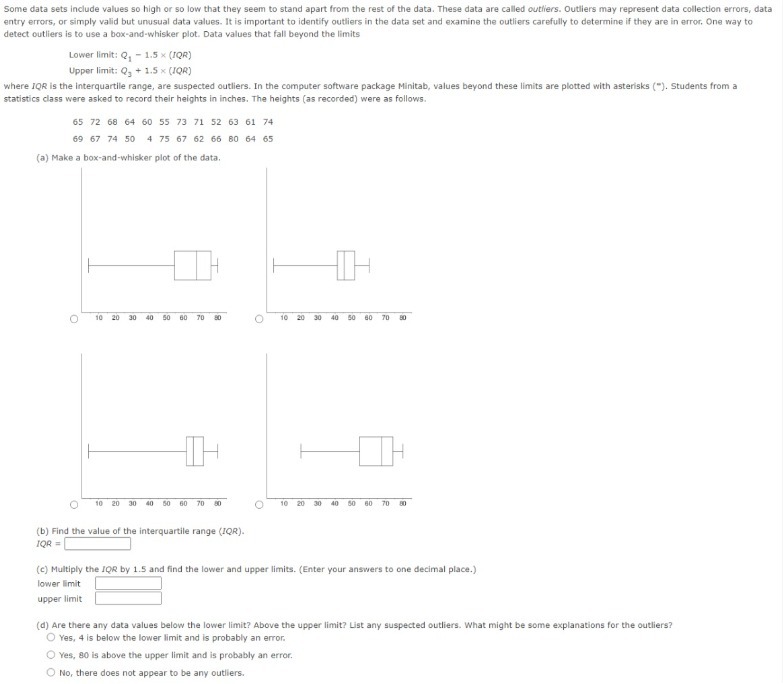
Some data sets include values so high or so low that they seem to stand apart from the rest of the data. These data are called outliers. Outliers may represent data collection errors, data entry errors, or simply valid but unusual data values. It is important to identify outliers in the data set and examine the outliers carefully to determine if they are in error, One way to detect outliers is to use a box-and-whisker plot. Data values that fall beyond the limits Lower limit: Q - 1.5 x (1QR) Upper limit: Q, + 1.5 x (IQR) where FOR is the interquartile range, are suspected outliers. In the computer software package Minitab, values beyond these limits are plotted with asterisks ("). Students from a statistics class were asked to record their heights in inches. The heights (as recorded) were as follows. 65 72 68 64 60 55 73 71 52 63 61 74 69 67 74 50 4 75 67 62 66 80 64 65 (a) Make a box-and-whisker plot of the data. 10 20 30 40 50 80 70 90 O 10 20 30 40 50 60 70 90 10 20 30 40 80 60 70 80 10 20 30 40 80 80 70 80 (b) Find the value of the interquartile range (IQR). TQR= (c) Multiply the FOR by 1.5 and find the lower and upper limits. (Enter your answers to one decimal place.) lower limit upper limit (d) Are there any data values below the lower limit? Above the upper limit? List any suspected outliers. What might be some explanations for the outliers? O Yes, 4 is below the lower limit and is probably an error. O Yes, 80 is above the upper limit and is probably an error. No, there does not appear to be any outliers
Step by Step Solution
There are 3 Steps involved in it

Get step-by-step solutions from verified subject matter experts