

Question: Some one can do d and e, I have answer of a b c One of the goals of the Edinburgh Artery Study was to
Some one can do d and e, I have answer of a b c
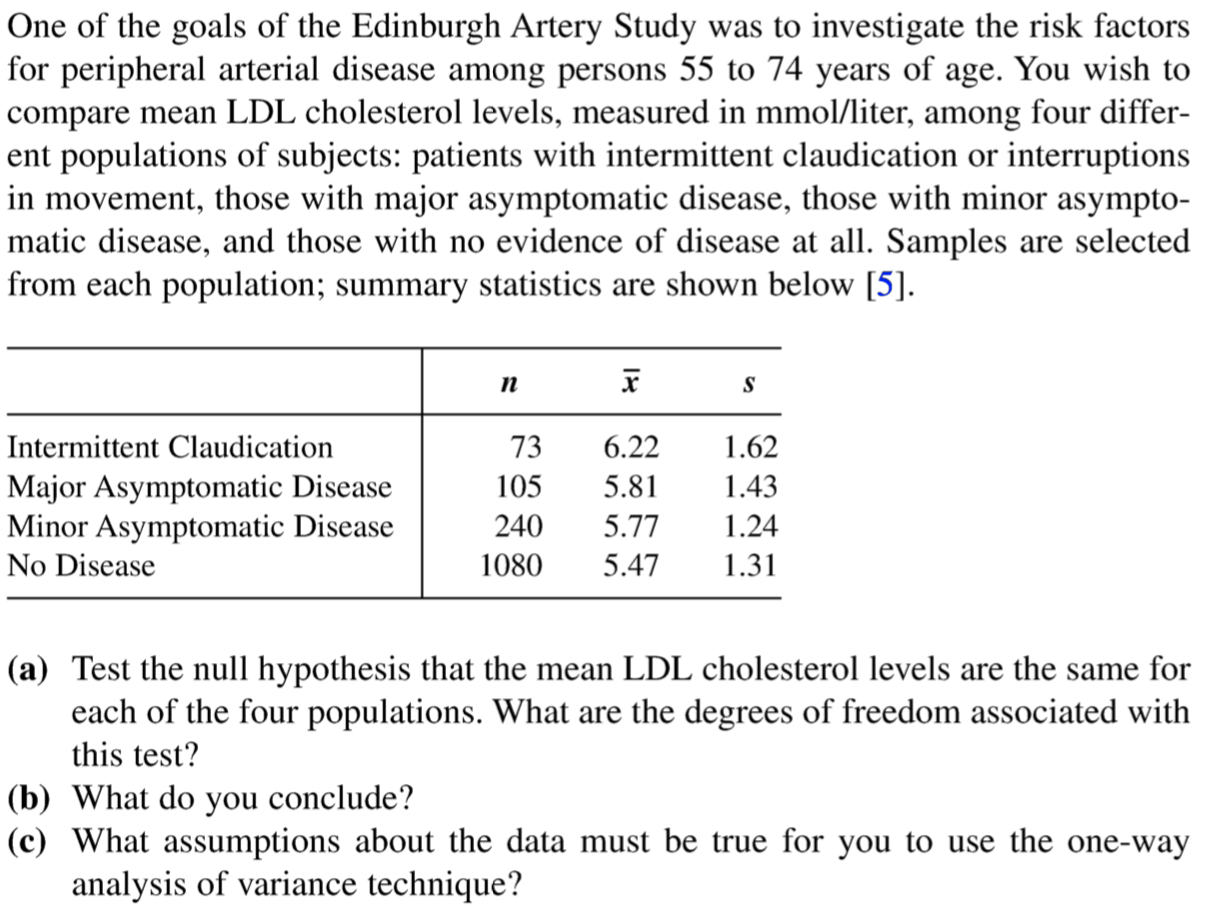
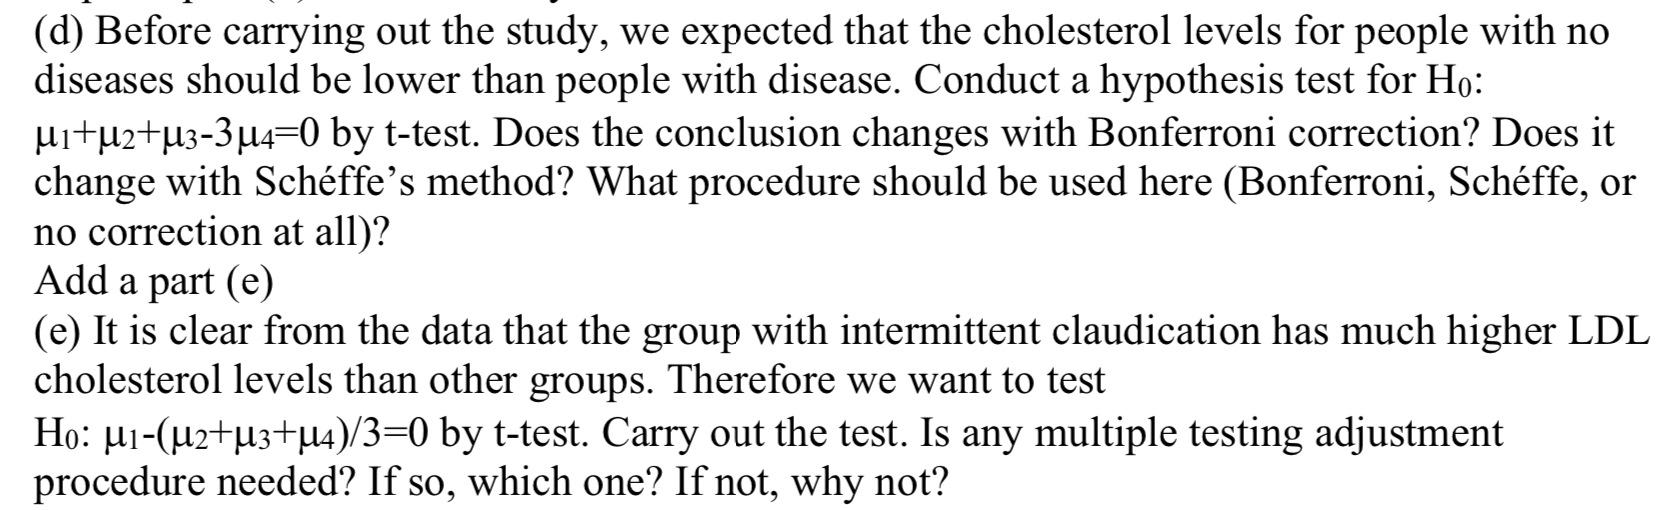
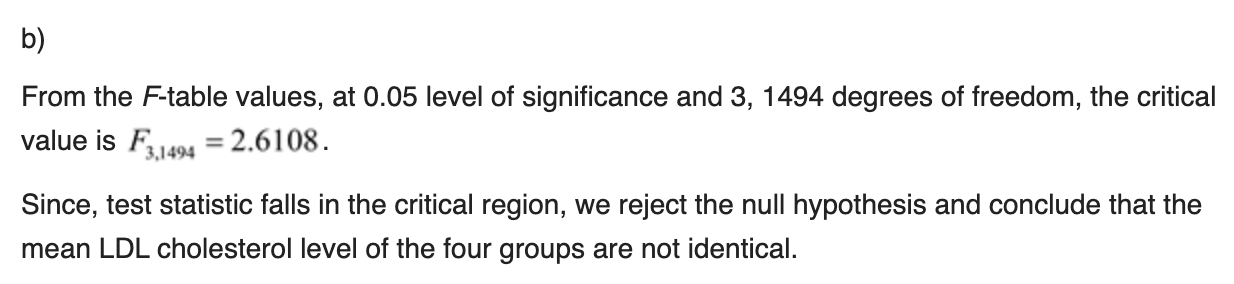
One of the goals of the Edinburgh Artery Study was to investigate the risk factors for peripheral arterial disease among persons 55 to 74 years of age. You wish to compare mean LDL cholesterol levels, measured in mmol/liter, among four differ- ent populations of subjects: patients with intermittent claudication or interruptions in movement, those with major asymptomatic disease, those with minor asympto- matic disease, and those with no evidence of disease at all. Samples are selected from each population; summary statistics are shown below [5]. 73 6.22 1.62 105 5.81 1.43 240 5.77 1.24 1080 5.47 1.31 Intermittent Claudication Major Asymptomatic Disease Minor Asymptomatic Disease No Disease (a) Test the null hypothesis that the mean LDL cholesterol levels are the same for each of the four populations. What are the degrees of freedom associated with this test? (b) What do you conclude? (c) What assumptions about the data must be true for you to use the one-way analysis of variance technique? (d) Before carrying out the study, we expected that the cholesterol levels for people with no diseases should be lower than people with disease. Conduct a hypothesis test for Ho: u1+u2+u3-3 u4=0 by t-test. Does the conclusion changes with Bonferroni correction? Does it change with Schffe's method? What procedure should be used here (Bonferroni, Schffe, or no correction at all)? Add a part (6) (e) It is clear from the data that the group with intermittent claudication has much higher LDL cholesterol levels than other groups. Therefore we want to test Ho: u1-(u2+u3+u4)/3=0 by t-test. Carry out the test. Is any multiple testing adjustment procedure needed? If so, which one? If not, why not? '0) From the F-table values, at 0.05 level of significance and 3, 1494 degrees of freedom, the critical value is rm = 2.6108. Since, test statistic falls in the critical region, we reject the null hypothesis and conclude that the mean LDL cholesterol level of the four groups are not identical
Step by Step Solution
There are 3 Steps involved in it

Get step-by-step solutions from verified subject matter experts