

Question: Someone help 2 Data example The data is drawn from measurements of PM2.5 pollution in Beijing over several years in the early twenty-first century. [Source:
Someone help
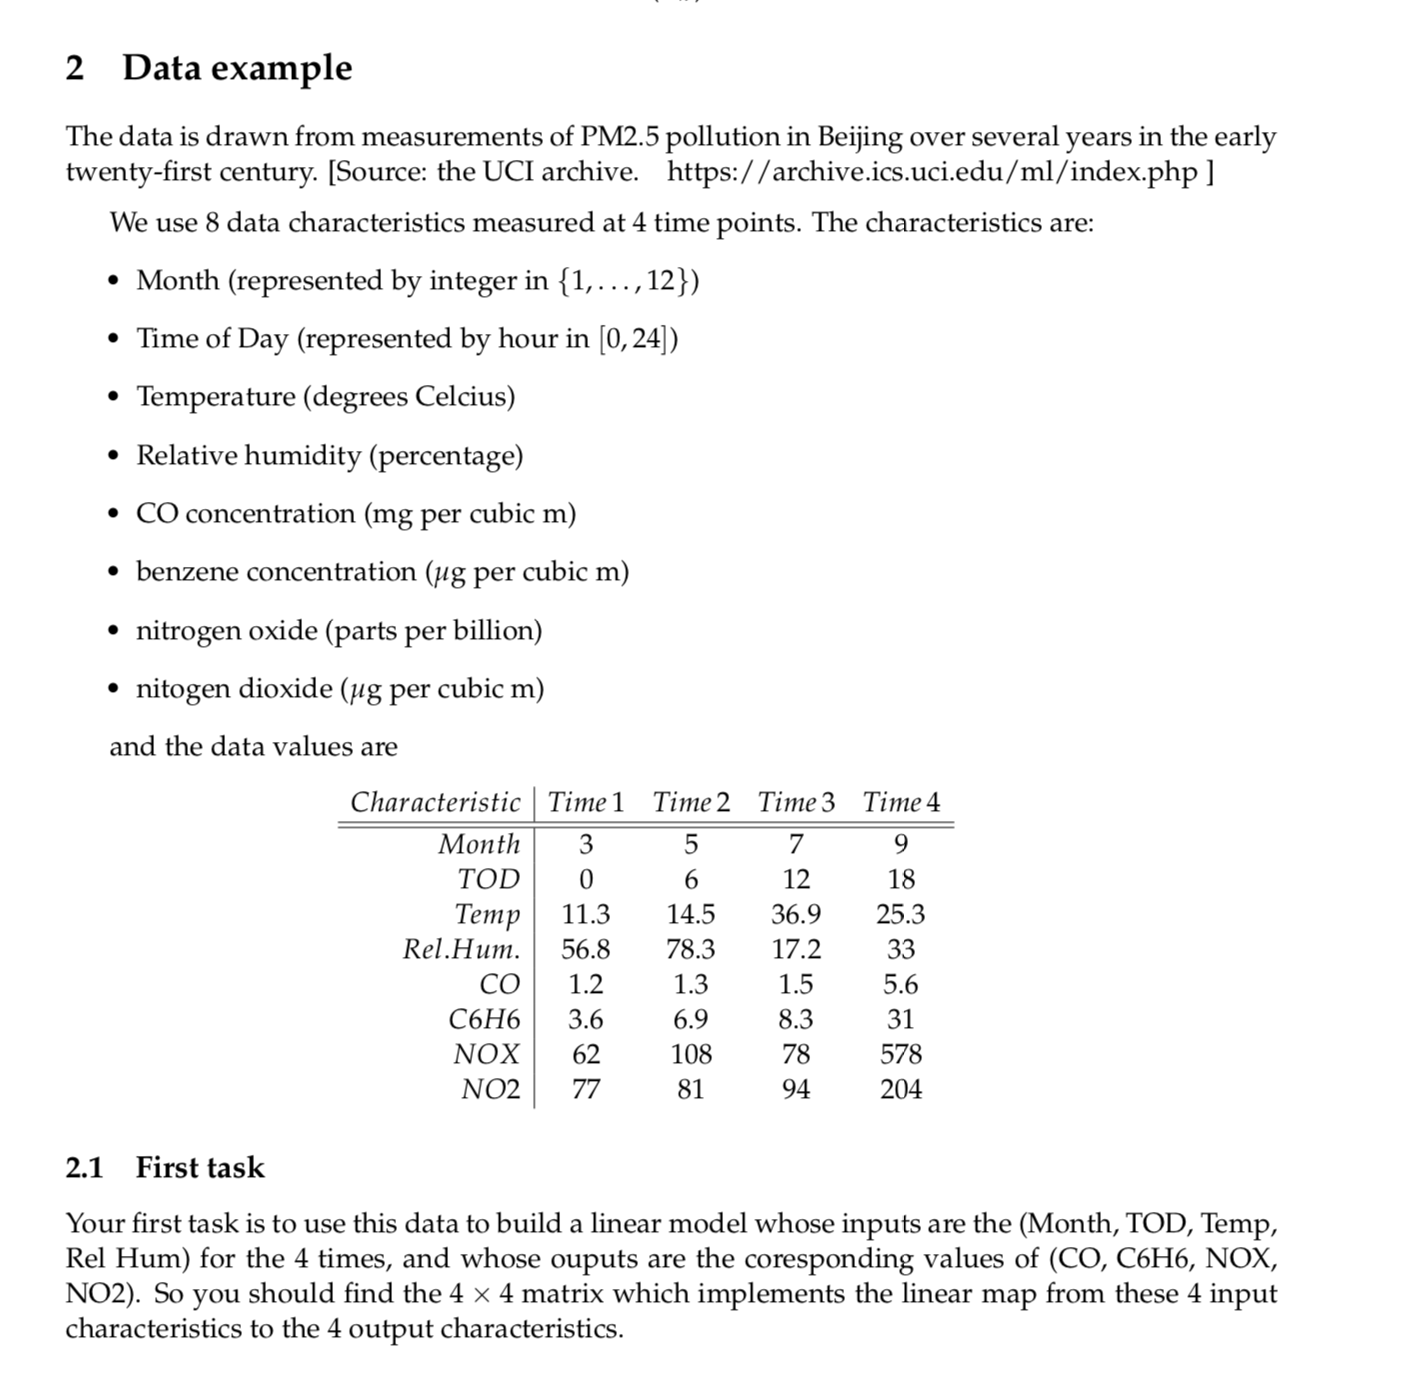
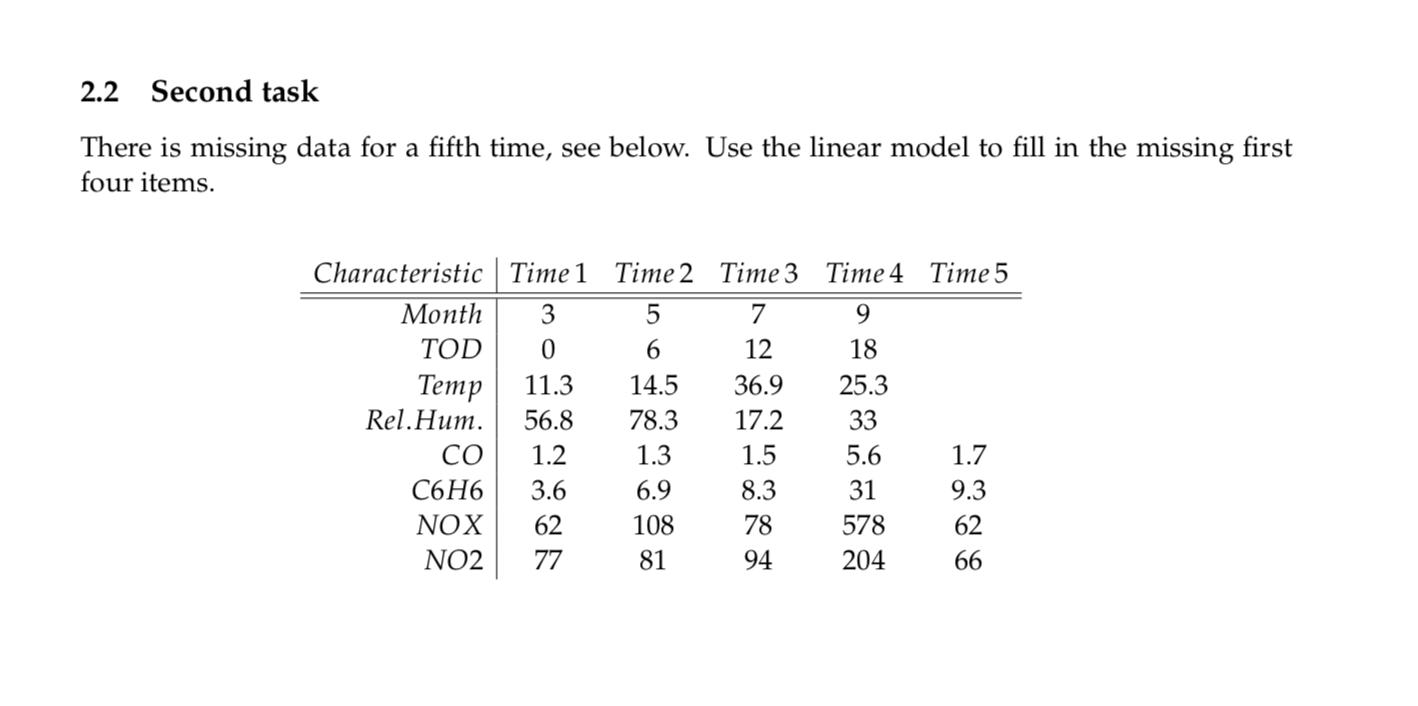
2 Data example The data is drawn from measurements of PM2.5 pollution in Beijing over several years in the early twenty-first century. [Source: the UCI archive. https:/ /archive.ics.uci.edu/ml/index.php ] We use 8 data characteristics measured at 4 time points. The characteristics are: . Month (represented by integer in {1, . .., 12}) . Time of Day (represented by hour in [0, 24]) . Temperature (degrees Celcius) . Relative humidity (percentage) . CO concentration (mg per cubic m) . benzene concentration (ug per cubic m) . nitrogen oxide (parts per billion) . nitogen dioxide (ug per cubic m) and the data values are Characteristic Time1 Time 2 Time 3 Time 4 Month 3 5 7 9 TOD 6 12 18 Temp 11.3 14.5 36.9 25.3 Rel.Hum. 56.8 78.3 17.2 33 CO 1.2 1.3 1.5 5.6 C6H6 3.6 6.9 8.3 31 NOX 62 108 78 578 NO2 77 81 94 204 2.1 First task Your first task is to use this data to build a linear model whose inputs are the (Month, TOD, Temp, Rel Hum) for the 4 times, and whose ouputs are the coresponding values of (CO, C6H6, NOX, NO2). So you should find the 4 x 4 matrix which implements the linear map from these 4 input characteristics to the 4 output characteristics.2.2 Second task There is missing data for a fifth time, see below. Use the linear model to fill in the missing first four items. Characteristic Time] Time2 Time3 Time4 TimeS Month 3 5 7 9 TOD O 6 12 18 Temp 11.3 14.5 36.9 25.3 Rel.Hum. 56.8 78.3 17.2 33 CO 1.2 1.3 1.5 5.6 1.7 C6H 6 3.6 6.9 8.3 31 9.3 NOX 62 108 78 578 62 N02 77 81 94 204 66
Step by Step Solution
There are 3 Steps involved in it

Get step-by-step solutions from verified subject matter experts