

Question: Someone plz help! Aggregate Cost Data Unit Cost Data Total Total Change in Quality of Tx. Fixed Variable Total Cost TFC TVC MCATC Output Plot
Someone plz help!
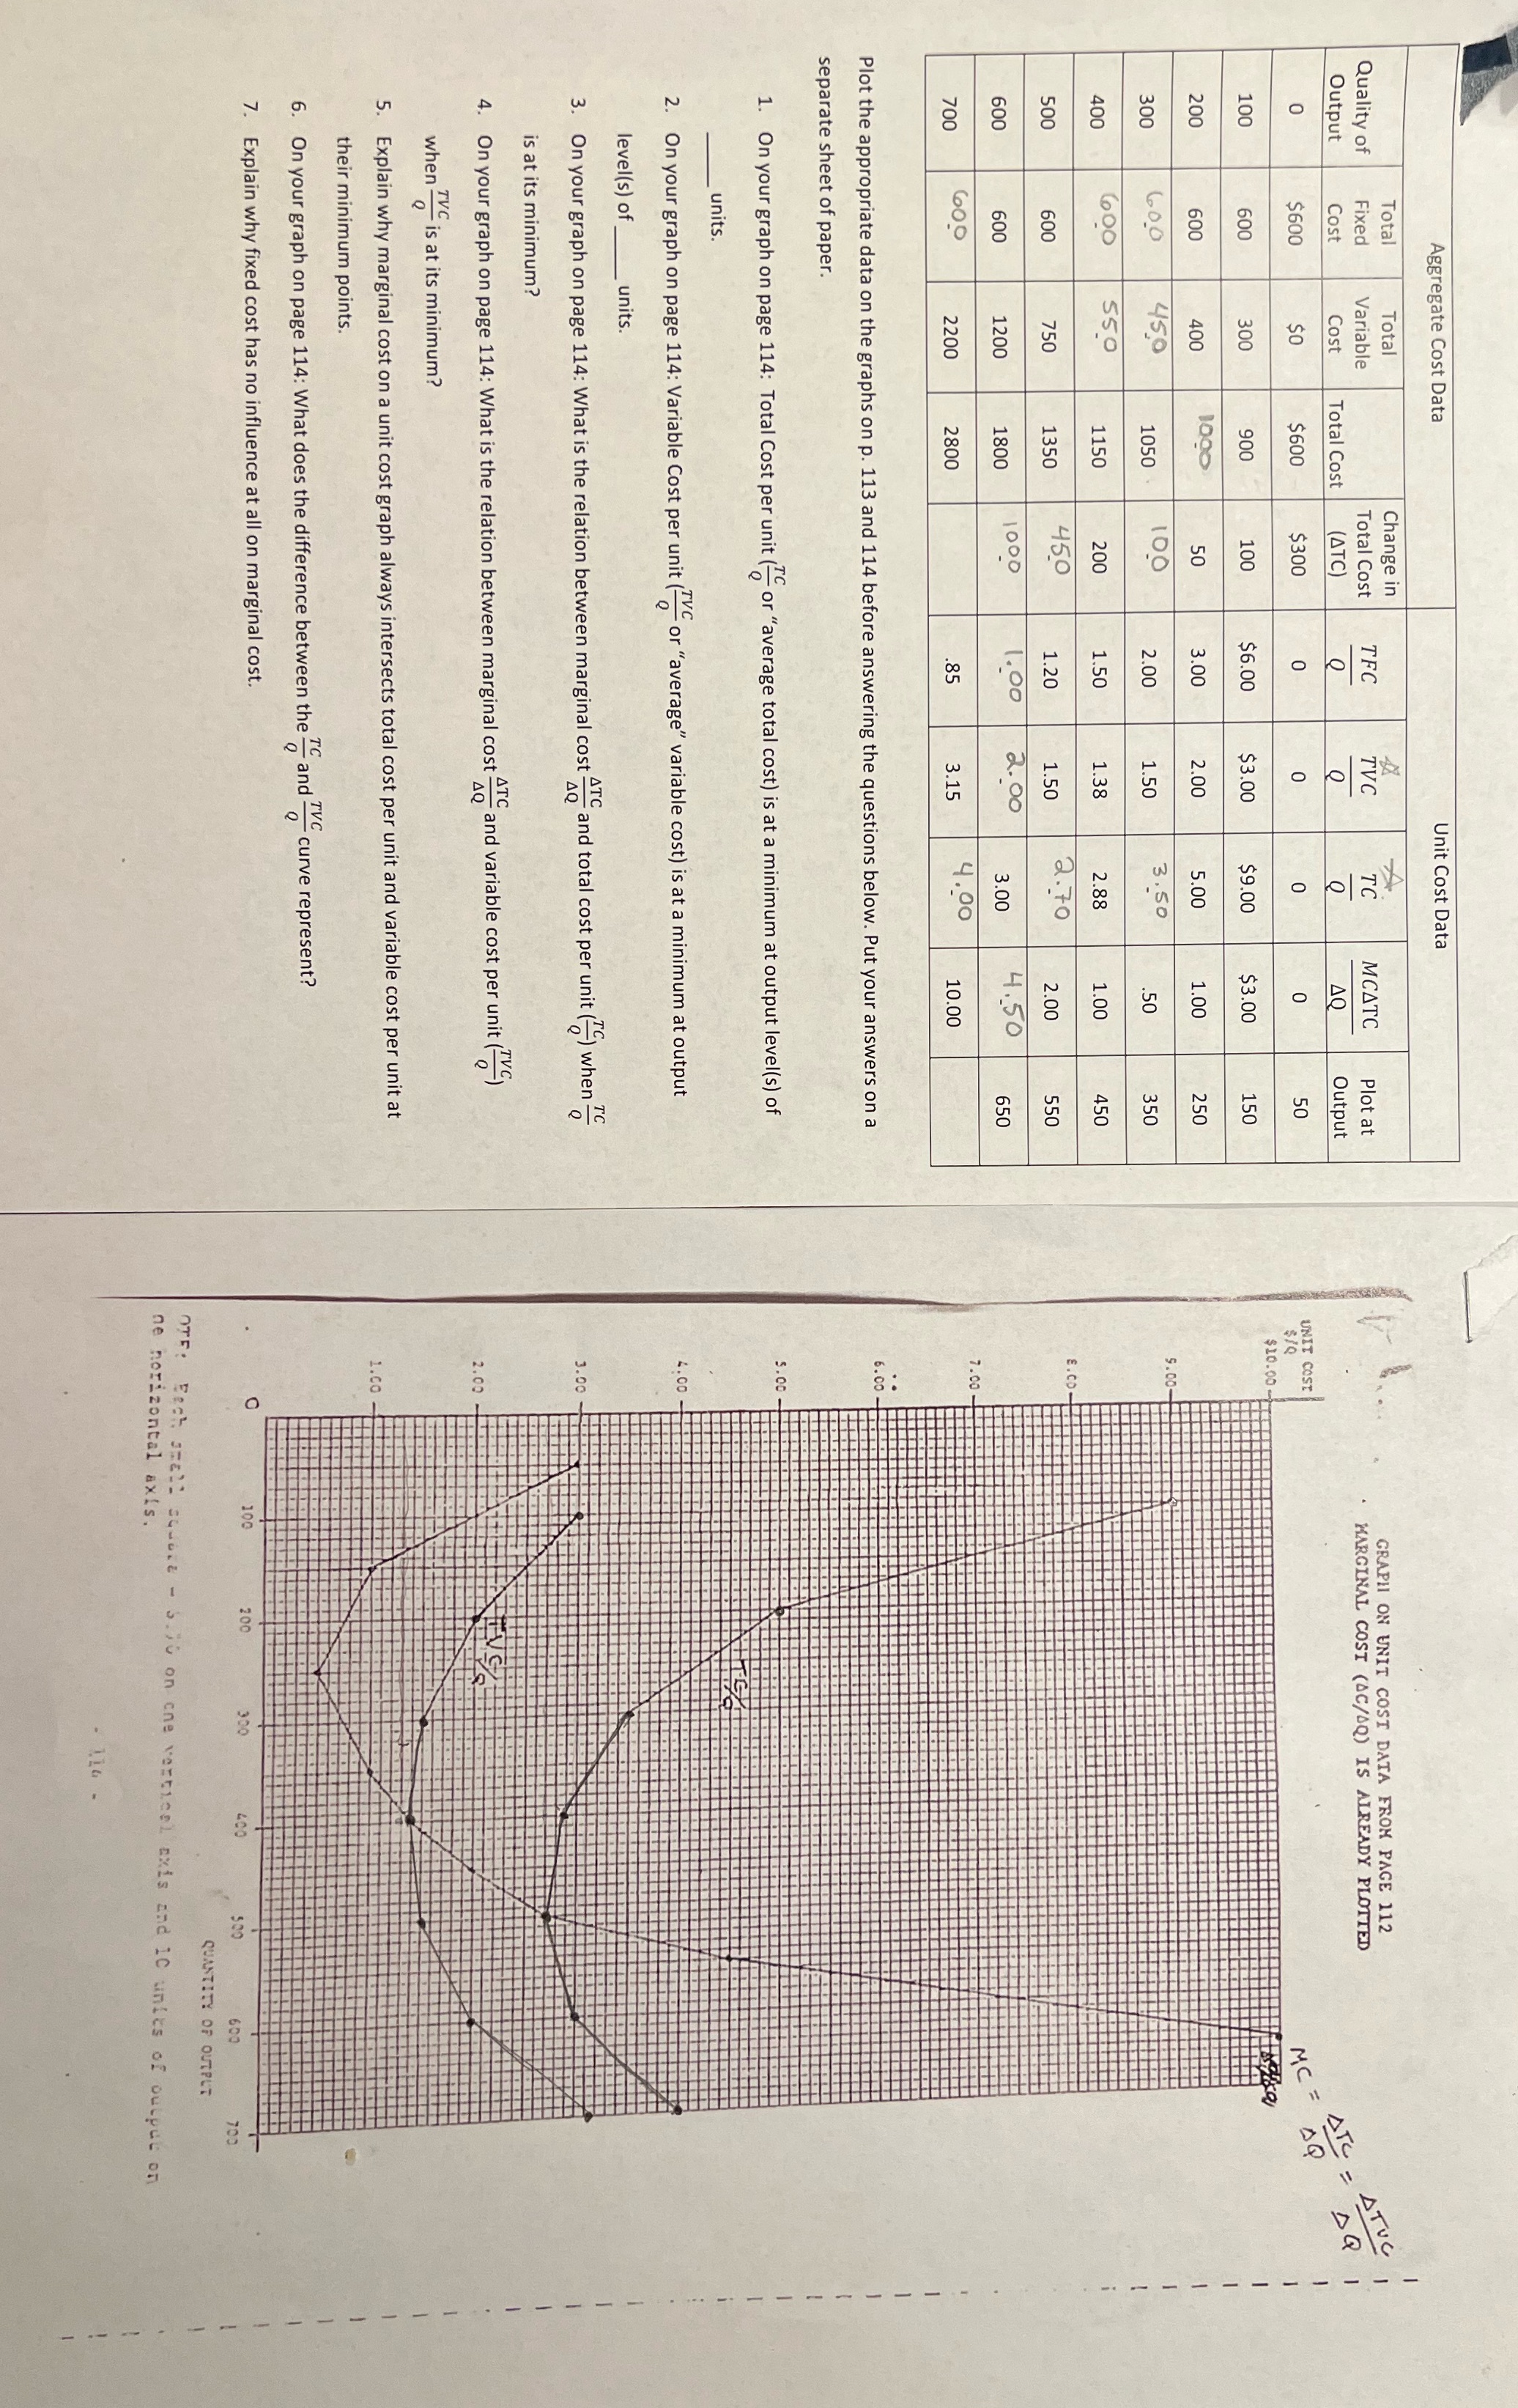
Aggregate Cost Data Unit Cost Data Total Total Change in Quality of Tx. Fixed Variable Total Cost TFC TVC MCATC Output Plot at GRAPH ON UNIT COST DATA FROM PAGE 112 Cost Cost Total Cost (ATC) Output MARGINAL COST (AC/Q) IS ALREADY PLOTTED ATVC O $600 $600 $300 C ATC - O UNIT COST $1Q MC = 100 600 300 900 LOO $6.0 $3.00 $9.00 $10.00 - 3.00 150 200 600 400 1000 3.00 2.00 5.00 1.00 250 300 600 450 1050 2.00 3.50 5.00- 1.50 350 400 550 1150 200 1.50 1.38 2.88 1.00 450 500 600 750 1350 450 1.20 1.50 2.to 2.00 550 600 600 1200 1800 . oo 2. 00 3.00 4.50 650 700 60O 2200 2800 3.15 4.00 7.00- 10.00 Plot the appropriate data on the graphs on p. 113 and 114 before answering the questions below. Put your answers on a 6.00 separate sheet of paper. 1. On your graph on page 114: Total Cost per unit ( or "average total cost) is at a minimum at output level(s) of 5.00 - units. 2. On your graph on page 114: Variable Cost per unit (or "average" variable cost) is at a minimum at output 4.00 - level (s ) of units . On your graph on page 114: What is the relation between marginal cost ATC a st so and total cost per unit (C) when TC 3.00 is at its minimum ? . On your graph on page 114: What is the relation between marginal cost ATC an st to and variable cost per unit (TVC) 2.00 when TVC ; is at its minimum? . Explain why marginal cost on a unit cost graph always intersects total cost per unit and variable cost per unit at their minimum points. 1.CO On your graph on page 114: What does the difference between the -and -curve represent? 7. Explain why fixed cost has no influence at all on marginal cost. 100 300 400 500 600 700 QUANTITY OF OUTPUT OFF: Each smell soNo.2 - 3. ;0 on one vertical axis and 10 units of output on ne horizontal axis. - 116
Step by Step Solution
There are 3 Steps involved in it

Get step-by-step solutions from verified subject matter experts