

Question: Sometimes a set of data has a very large range (very small numbers to very big numbers). This is often the case with signal-to-noise ratios
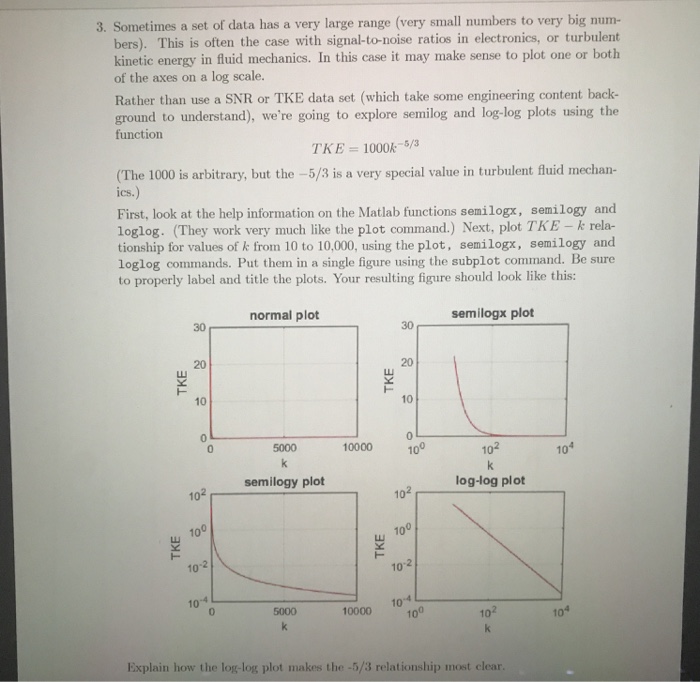
Sometimes a set of data has a very large range (very small numbers to very big numbers). This is often the case with signal-to-noise ratios in electronics, or turbulent kinetic energy in fluid mechanics. In this case it may make sense to plot one or both of the axes on a log scale. Rather than use a SNR or TKE data set (which take some engineering content back- ground to understand), we're going to explore semilog and log-log plots using the function TKE = 1000k^-5/3 (The 1000 is arbitrary, but the -5/3 is a very special value in turbulent fluid mechanics.) First, look at the help information on the Matlab functions semilogx, semilogy and loglog. (They work very much like the plot command.) Next, plot TKE - k relationship for values of k from 10 to 10,000, using the plot, semilogx, semilogy and loglog commands. Put them in a single figure using the subplot command. Be sure to properly label and title the plots. Your resulting figure should look like this: Explain how the log-log plot makes the -5/3 relationship most clear
Step by Step Solution
There are 3 Steps involved in it

Get step-by-step solutions from verified subject matter experts