

Question: In this lab we will be investigating the relationship between the height of a roller coaster and its speed. Suppose we are interested in
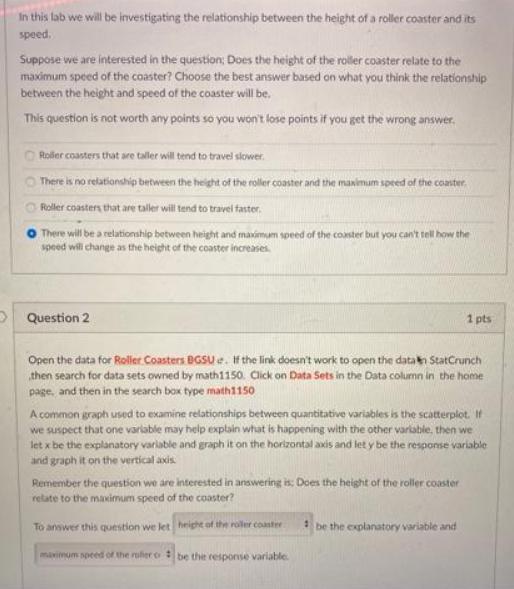
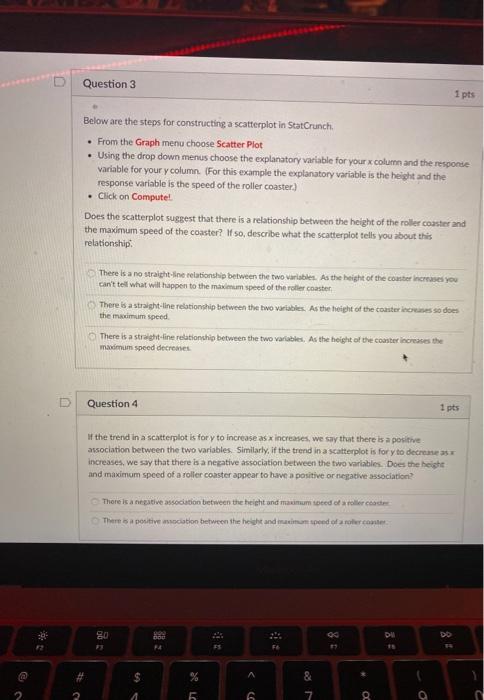
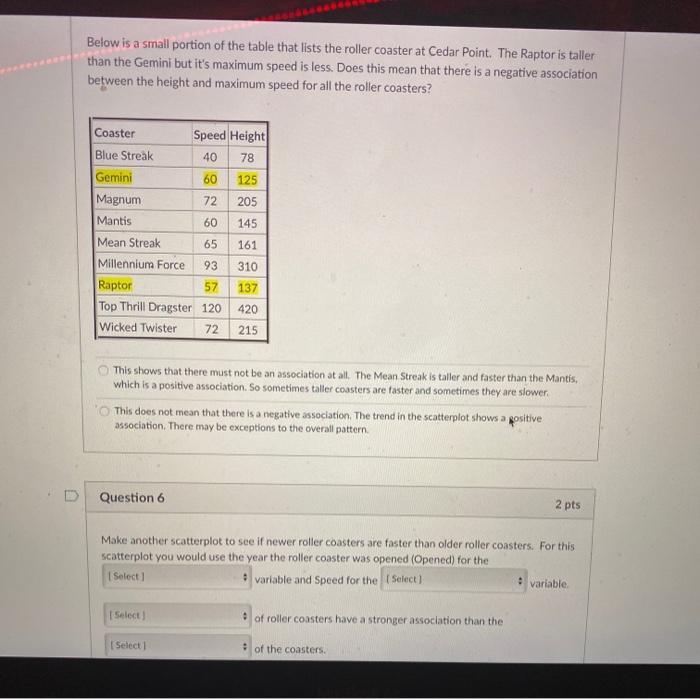
In this lab we will be investigating the relationship between the height of a roller coaster and its speed. Suppose we are interested in the question; Does the height of the roller coaster relate to the maximum speed of the coaster? Choose the best answer based on what you think the relationship between the height and speed of the coaster will be. This question is not worth any points so you won't lose points if you get the wrong answer. Roller coasters that are taller wi will tend to travel slower. There is no relationship between the height of the roller coaster and the maximum speed of the coaster Roller coasters that are taller will tend to travel faster. There will be a relationship between height and maximum speed of the coaster but you can't tell how the speed will change as the height of the coaster increases. Question 2 Open the data for Roller Coasters BGSU e. If the link doesn't work to open the data StatCrunch then search for data sets owned by math1150. Click on Data Sets in the Data column in the home page, and then in the search box type math1150 1 pts A common graph used to examine relationships between quantitative variables is the scatterplot. If we suspect that one variable may help explain what is happening with the other variable, then we let x be the explanatory variable and graph it on the horizontal axis and let y be the response variable and graph it on the vertical axis. Remember the question we are interested in answering is: Does the height of the roller coaster relate to the maximum speed of the coaster? To answer this question we let height of the roller coaster maximum speed of the ruller o be the response variable. 1 be the explanatory variable and @ 2 # 2 Question 3 Below are the steps for constructing a scatterplot in StatCrunch. From the Graph menu choose Scatter Plot . Using the drop down menus choose the explanatory variable for your x column and the response variable for your y column. (For this example the explanatory variable is the height and the response variable is the speed of the roller coaster) . Click on Compute! Does the scatterplot suggest that there is a relationship between the height of the roller coaster and the maximum speed of the coaster? If so, describe what the scatterplot tells you about this relationship. There is a no straight-line relationship between the two variables. As the height of the coaster increases you can't tell what will happen to the maximum speed of the roller coaster If There is a straight-line relationship between the two variables. As the height of the coaster increases so does the maximum speed. There is a straight-line relationship between the two variables. As the height of the coaster increases the maximum speed decreases Question 4 in a scatterplot is for y to increase as x increases, we say that there is a positive association between the two variables. Similarly, if the trend in a scatterplot is for y to decrease as x increases, we say that there is a negative association between the two variables. Does the height and maximum speed of a roller coaster appear to have a positive or negative association? There is a negative association between the height and maximum speed of a roller coaster There is a positive association between the height and maximam speed of a roller coaster 80 FF $ A F4 5 # ^ 6 F6 & 7 8 D 1 pts . 8 DI O 1 pts DD Below is a small portion of the table that lists the roller coaster at Cedar Point. The Raptor is taller than the Gemini but it's maximum speed is less. Does this mean that there is a negative association between the height and maximum speed for all the roller coasters? Coaster Blue Streak Gemini Magnum Mantis Mean Streak Millennium Force Raptor 137 Top Thrill Dragster 120 420 Wicked Twister 72 215 This shows that there must not be an association at all. The Mean Streak is taller and faster than the Mantis, which is a positive association. So sometimes taller coasters are faster and sometimes they are slower. Question 6 Speed Height 40 78 60 125 72 205 60 145 65 161 93 310 57 This does not mean that there is a negative association. The trend in the scatterplot shows a positive association. There may be exceptions to the overall pattern. 22 [Select] [Select] Make another scatterplot to see if newer roller coasters are faster than older roller coasters. For this scatterplot you would use the year the roller coaster was opened (Opened) for the [Select] variable and Speed for the [Select] 2 pts of roller coasters have a stronger association than the of the coasters. variable.
Step by Step Solution
3.41 Rating (148 Votes )
There are 3 Steps involved in it
The scatterplot suggests that there is a positive relationship between the height of the roller coaster and the maximum speed of the coaster As the height of the coaster increases the maximum speed al... View full answer

Get step-by-step solutions from verified subject matter experts