

Question: sooner is better Question 1 You are provided with five possible portfolios to select. The portfolios are made up of a combination of three assets:
| sooner is better Question 1 | ||||||||||||||||||||||
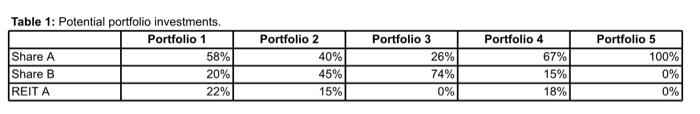
| You are provided with five possible portfolios to select. The portfolios are made up of a combination of three assets: Share A, Share B, and REIT A. | ||||||||||||||||||||||
| The weightings of each asset per portfolio are shown in Table 1. | ||||||||||||||||||||||
| A portfolio risk and return calculator is provided for you to calculate the portfolio return, portfolio standard deviation, and standard deviation of the portfolio's excess return given a specific portfolio weighting. |
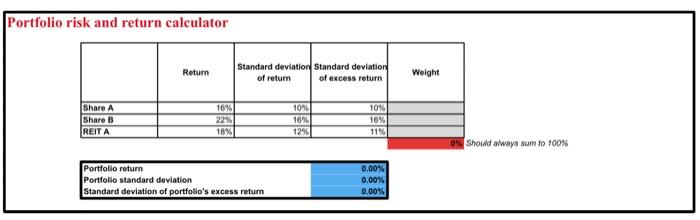
| Use the asset weightings provided in Table 1 and the portfolio risk and return calculator above to calculate the following: | For tutor use only | |||||||||||||||||||||
| > | Portfolio return (rounded to the nearest two decimal places) | |||||||||||||||||||||
| > | Portfolio standard deviation (rounded to the nearest two decimal places) | |||||||||||||||||||||
| > | Standard deviation of portfolio's excess return (rounded to two decimal places) | |||||||||||||||||||||
| For example, include the asset weights provided in Table 1 for Portfolio 1 in the grey blocks in the portfolio risk and return calculator. | ||||||||||||||||||||||
| The portfolio return, portfolio standard deviation, and standard deviation of portfolio's excess return for Portfolio 1 will be calculated automatically in the blue blocks. | ||||||||||||||||||||||
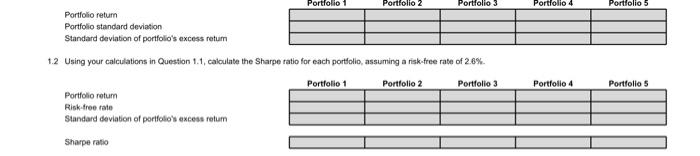
| Enter the answers that appear in the blue blocks for Portfolio 1 in the grey blocks in the table below. Repeat for each of the other portfolios |
| 1.3 | Assume that you are a rational investor (i.e. you wish to maximise your return at a given risk level). | |||||||||||||||||||||
| Based on the calculations you performed in Question 1.2, which of the five portfolios would you choose to invest in and why? | ||||||||||||||||||||||
| Limit your answer to 20 words. | ||||||||||||||||||||||
| Start writing here: | ||||||||||||||||||||||
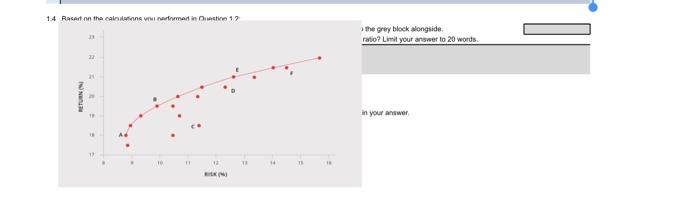
Table 1: Potential oortfolio investments. Portfolio risk and return calculator Shoudd aways sum to 100% Portfolio retum Portfolio standard deviation Standard deviation of portfolio's excess retum 1.2 Using your calculations in Question 1.1, calculate the Sharpe ratio for each portfolio, assuming a risk-free rate of 2.6%. Portfolie 1 Pertfolio 2 Portfolio 3 Portfolie 4 Portfolio 5 Portfolo retum Risk-tree rate Standard deviation of porffolio's excess retum Sharpe ratio Tt the grey bleck alongwide. Figure 1: The effciers bontier. 2.1 Which letters correspend to eticient portfotos? Start witing hece: 2.2. Provide one example of an ineficient portolio. Start writing here: 2.3 Which portlolio prequides the greatest retum for the lowest risk? Start wnting here: Table 1: Potential oortfolio investments. Portfolio risk and return calculator Shoudd aways sum to 100% Portfolio retum Portfolio standard deviation Standard deviation of portfolio's excess retum 1.2 Using your calculations in Question 1.1, calculate the Sharpe ratio for each portfolio, assuming a risk-free rate of 2.6%. Portfolie 1 Pertfolio 2 Portfolio 3 Portfolie 4 Portfolio 5 Portfolo retum Risk-tree rate Standard deviation of porffolio's excess retum Sharpe ratio Tt the grey bleck alongwide. Figure 1: The effciers bontier. 2.1 Which letters correspend to eticient portfotos? Start witing hece: 2.2. Provide one example of an ineficient portolio. Start writing here: 2.3 Which portlolio prequides the greatest retum for the lowest risk? Start wnting here
Step by Step Solution
There are 3 Steps involved in it

Get step-by-step solutions from verified subject matter experts