

Question: S&OP Example Demand Forecast: Quarter Demand (units) 1 9,000 2 12,000 3 15,000 4 12,000 Costs: Constraints: Start inventory = 1000 units Ending inventory
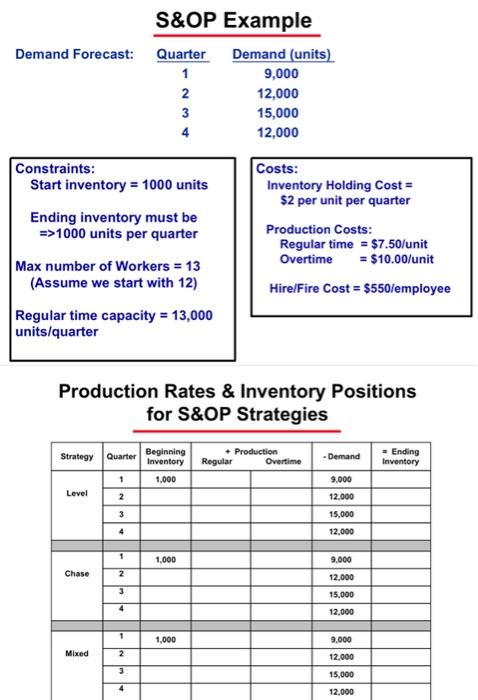
S&OP Example Demand Forecast: Quarter Demand (units) 1 9,000 2 12,000 3 15,000 4 12,000 Costs: Constraints: Start inventory = 1000 units Ending inventory must be =>1000 units per quarter Max number of Workers = 13 (Assume we start with 12) Regular time capacity = 13,000 units/quarter Inventory Holding Cost = $2 per unit per quarter Production Costs: Regular time = $7.50/unit Overtime = $10.00/unit Hire/Fire Cost $550/employee Production Rates & Inventory Positions for S&OP Strategies Strategy Quarter Beginning Inventory + Production -Demand Regular Overtime = Ending Inventory 1 1,000 9,000 Level 2 12,000 3 15,000 4 12,000 1 1,000 9,000 Chase 2 12,000 3 15,000 4 12,000 1 1,000 9,000 Mixed 2 12,000 3 15,000 4 12,000
Step by Step Solution
There are 3 Steps involved in it

Get step-by-step solutions from verified subject matter experts