

Question: . Sorry for being late Note: Problem P17-36B should be used only after completing Problem P17-35B. P17-36B Preparing common-size statements, analysis of profitability and financial
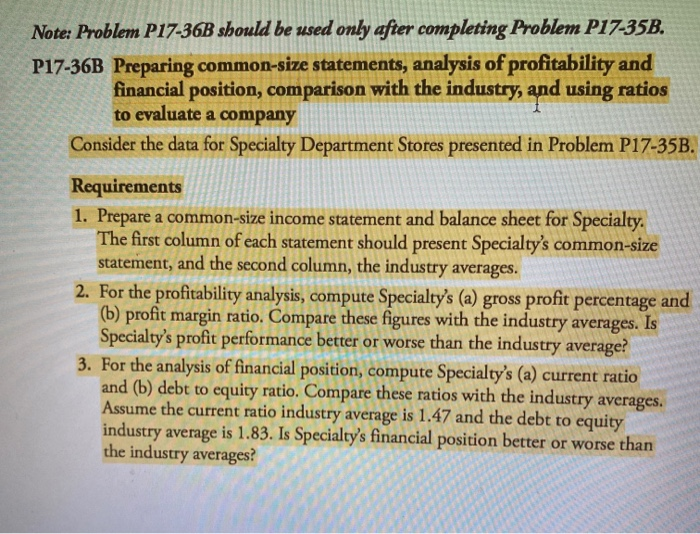
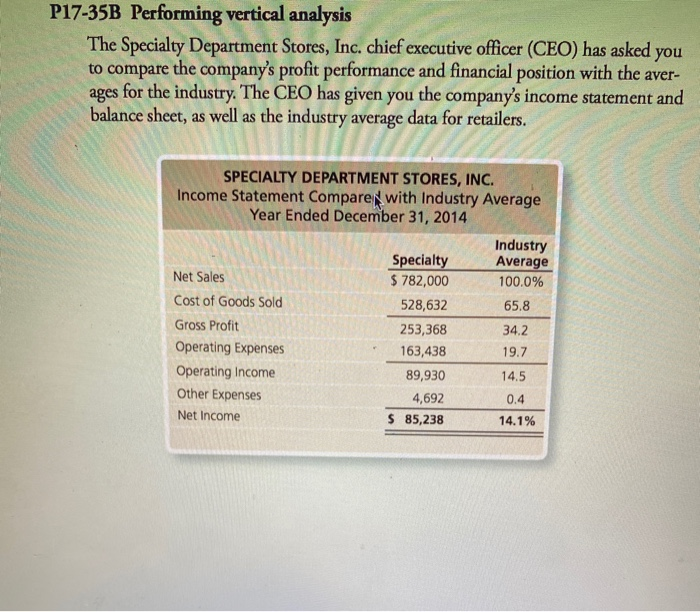
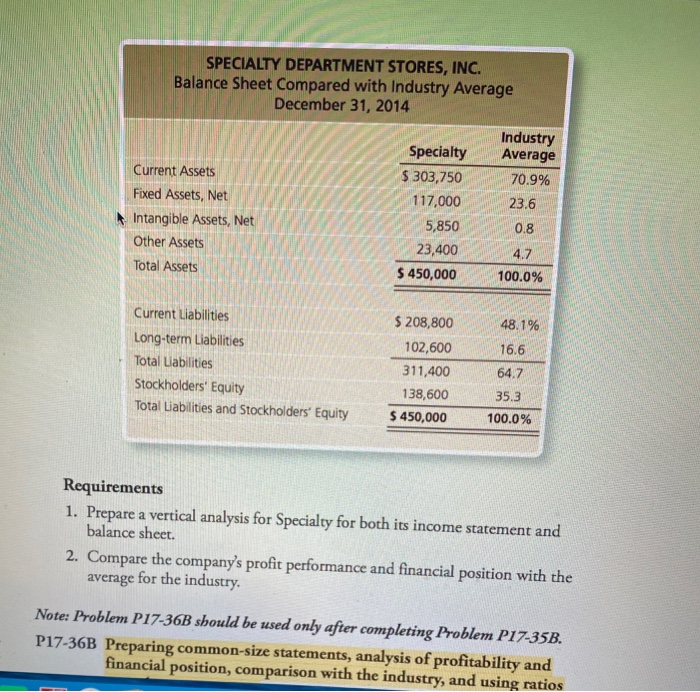
Note: Problem P17-36B should be used only after completing Problem P17-35B. P17-36B Preparing common-size statements, analysis of profitability and financial position, comparison with the industry, and using ratios to evaluate a company Consider the data for Specialty Department Stores presented in Problem P17-35B. Requirements 1. Prepare a common-size income statement and balance sheet for Specialty. The first column of each statement should present Specialty's common-size statement, and the second column, the industry averages. 2. For the profitability analysis, compute Specialty's (a) gross profit percentage and (b) profit margin ratio. Compare these figures with the industry averages. Is Specialty's profit performance better or worse than the industry average! 3. For the analysis of financial position, compute Specialty's (a) current ratio and (b) debt to equity ratio. Compare these ratios with the industry averages. Assume the current ratio industry average is 1.47 and the debt to equity industry average is 1.83. Is Specialty's financial position better or worse than the industry averages? P17-35B Performing vertical analysis The Specialty Department Stores, Inc. chief executive officer (CEO) has asked you to compare the company's profit performance and financial position with the aver- ages for the industry. The CEO has given you the company's income statement and balance sheet, as well as the industry average data for retailers. SPECIALTY DEPARTMENT STORES, INC. Income Statement Compare with Industry Average Year Ended December 31, 2014 Industry Specialty Average Net Sales $ 782,000 100.0% Cost of Goods Sold 528,632 65.8 Gross Profit 253,368 34.2 Operating Expenses 163,438 19.7 Operating Income 89,930 14.5 Other Expenses 4,692 0.4 Net Income $ 85,238 14.1% SPECIALTY DEPARTMENT STORES, INC. Balance Sheet Compared with Industry Average December 31, 2014 Industry Specialty Average Current Assets $ 303,750 70.9% Fixed Assets, Net 117,000 23.6 Intangible Assets, Net 5,850 0.8 Other Assets 23,400 4.7 Total Assets $ 450,000 100.0% 48.1% Current Liabilities Long-term Liabilities Total Liabilities Stockholders' Equity Total Liabilities and Stockholders' Equity $ 208,800 102,600 311,400 138,600 $ 450,000 16.6 64.7 35.3 100.0% Requirements 1. Prepare a vertical analysis for Specialty for both its income statement and balance sheet. 2. Compare the company's profit performance and financial position with the average for the industry. Note: Problem P17-36B should be used only after completing Problem P17-35B. P17-36B Preparing common-size statements, analysis of profitability and financial position, comparison with the industry, and using ratios
Step by Step Solution
There are 3 Steps involved in it

Get step-by-step solutions from verified subject matter experts