

Question: Source code to work with: import csv def main(): files = input(Temperature anomaly filename:) k = int(input(Enter window size:)) with open(files) as file: tep =
 Source code to work with:
import csv def main(): files = input("Temperature anomaly filename:") k = int(input("Enter window size:")) with open(files) as file: tep = [] file.readline() for line in file: line = line.strip(" ").split(",") line[1] = float(line[1]) tep.append(line[1])
index = k year = 1880 + index av = sum(tep[index-k:index+k+1]) / (2*k+1) print(year, f"{av:.4f}", sep=',') if __name__ == "__main__": main()
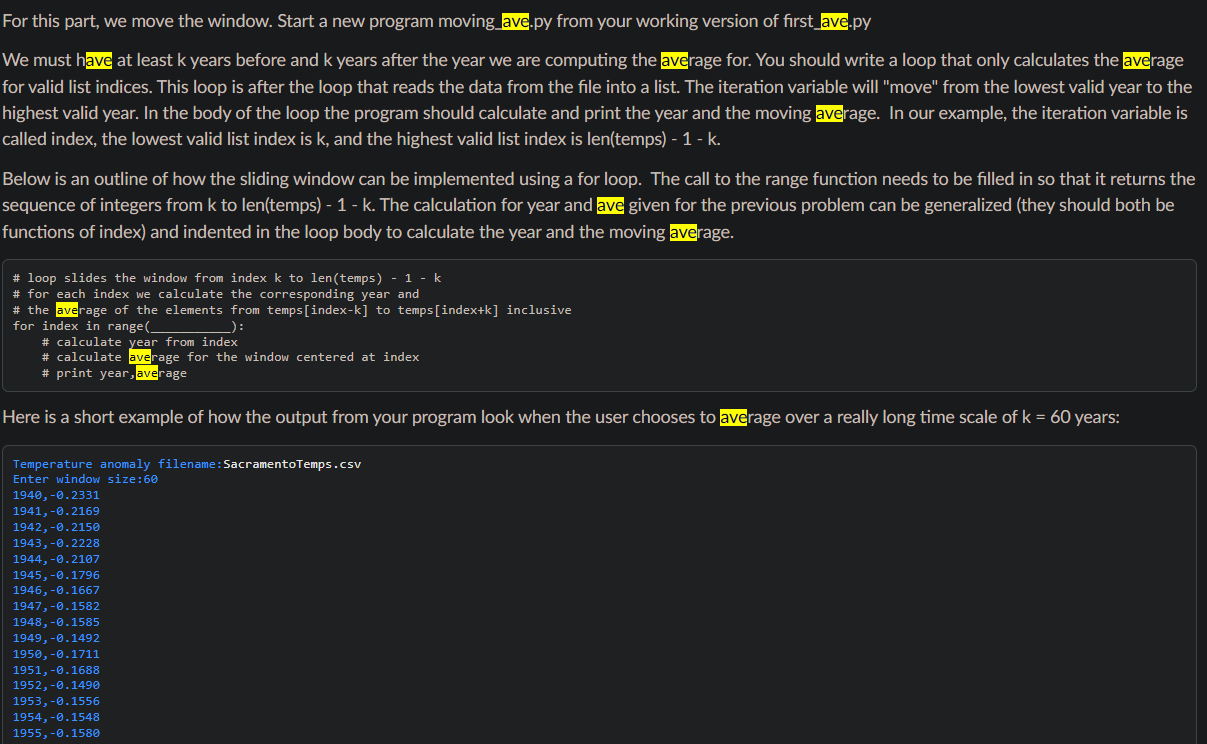
For this part, we move the window. Start a new program moving_ave.py from your working version of first_ave.py We must have at least k years before and k years after the year we are computing the average for. You should write a loop that only calculates the average for valid list indices. This loop is after the loop that reads the data from the file into a list. The iteration variable will "move" from the lowest valid year to the highest valid year. In the body of the loop the program should calculate and print the year and the moving average. In our example, the iteration variable is called index, the lowest valid list index is k, and the highest valid list index is len(temps) - 1k. Below is an outline of how the sliding window can be implemented using a for loop. The call to the range function needs to be filled in so that it returns the sequence of integers from k to len(temps) - 1k. The calculation for year and ave given for the previous problem can be generalized (they should both be functions of index) and indented in the loop body to calculate the year and the moving average. \# loop slides the window from index k to len(temps) - 1k \# for each index we calculate the corresponding year and \# the average of the elements from temps[index- k ] to temps[index+ k ] inclusive for index in range( \# calculate year from index \# calculate average for the window centered at index \# print year, average Here is a short example of how the output from your program look when the user chooses to average over a really long time scale of k=60 years: Temperature anomaly filename:SacramentoTemps.csv Enter window size: 60 1940,0.2331 1941,0.2169 1942,0.2150 1943,0.2228 1944,0.2107 1945,0.1796 1946,0.1667 1947,0.1582 1948,0.1585 1949,0.1492 1950,0.1711 1951,0.1688 1952,0.1490 1953,0.1556 1954,0.1548 1955,0.1580
Step by Step Solution
There are 3 Steps involved in it

Get step-by-step solutions from verified subject matter experts