

Question: Source of data: Golub et al . ( 1 9 9 9 ) . Molecular classification of cancer: class discovery and class prediction by gene
Source of data: Golub et al Molecular classification of cancer: class discovery and class prediction by
gene expression monitoring, Science, Vol. :
The data set golub consists of the expression levels of genes for tumor mRNA samples. Each tumor
mRNA sample comes from one patient ie patients total and of these tumor samples correspond to
acute lymphoblastic leukemia ALL and the remaining to acute myeloid leukemia AML
You will need to discover how many genes can be used to differentiate the tumor types meaning that their
expression level differs between the two tumor types using
the uncorrected pvalues,
the HolmBonferroni correction, and iii the BenjaminiHochberg correction?
Feel free to use libraries for multiple hypothesis testing in or python.
If you are using Python, you can use the following code to load the data:
with zipfile.ZipFilestatsreviewreleasezip" as zipfile:
golubdata, golubclassnames npgenfromtxtzipfile.opendataandmaterials
golubdataformatfname delimiter namesTrue, converters: lambda s:
intsstripb for fname in golubcsve, 'golubclcsv
Part a
points graded
Let be the mean of the expression levels for gene i across the ALL mRNA samples. Similarly, let
be the same but for the AML mRNA samples instead.
For each of these, and are the number of mRNA samples for the ALL tumors and AML tumors
respectively.
If is the sample variance for gene i across the ALL mRNA observations, then the corresponding
variance for is
We can use as a metric for the difference in expression levels for gene The
variance of this metric is
This allows us to use the following test statistic:
which you can recognize as similar to the ttest statistic, and is itself known as the Welch unequal variances t
test.
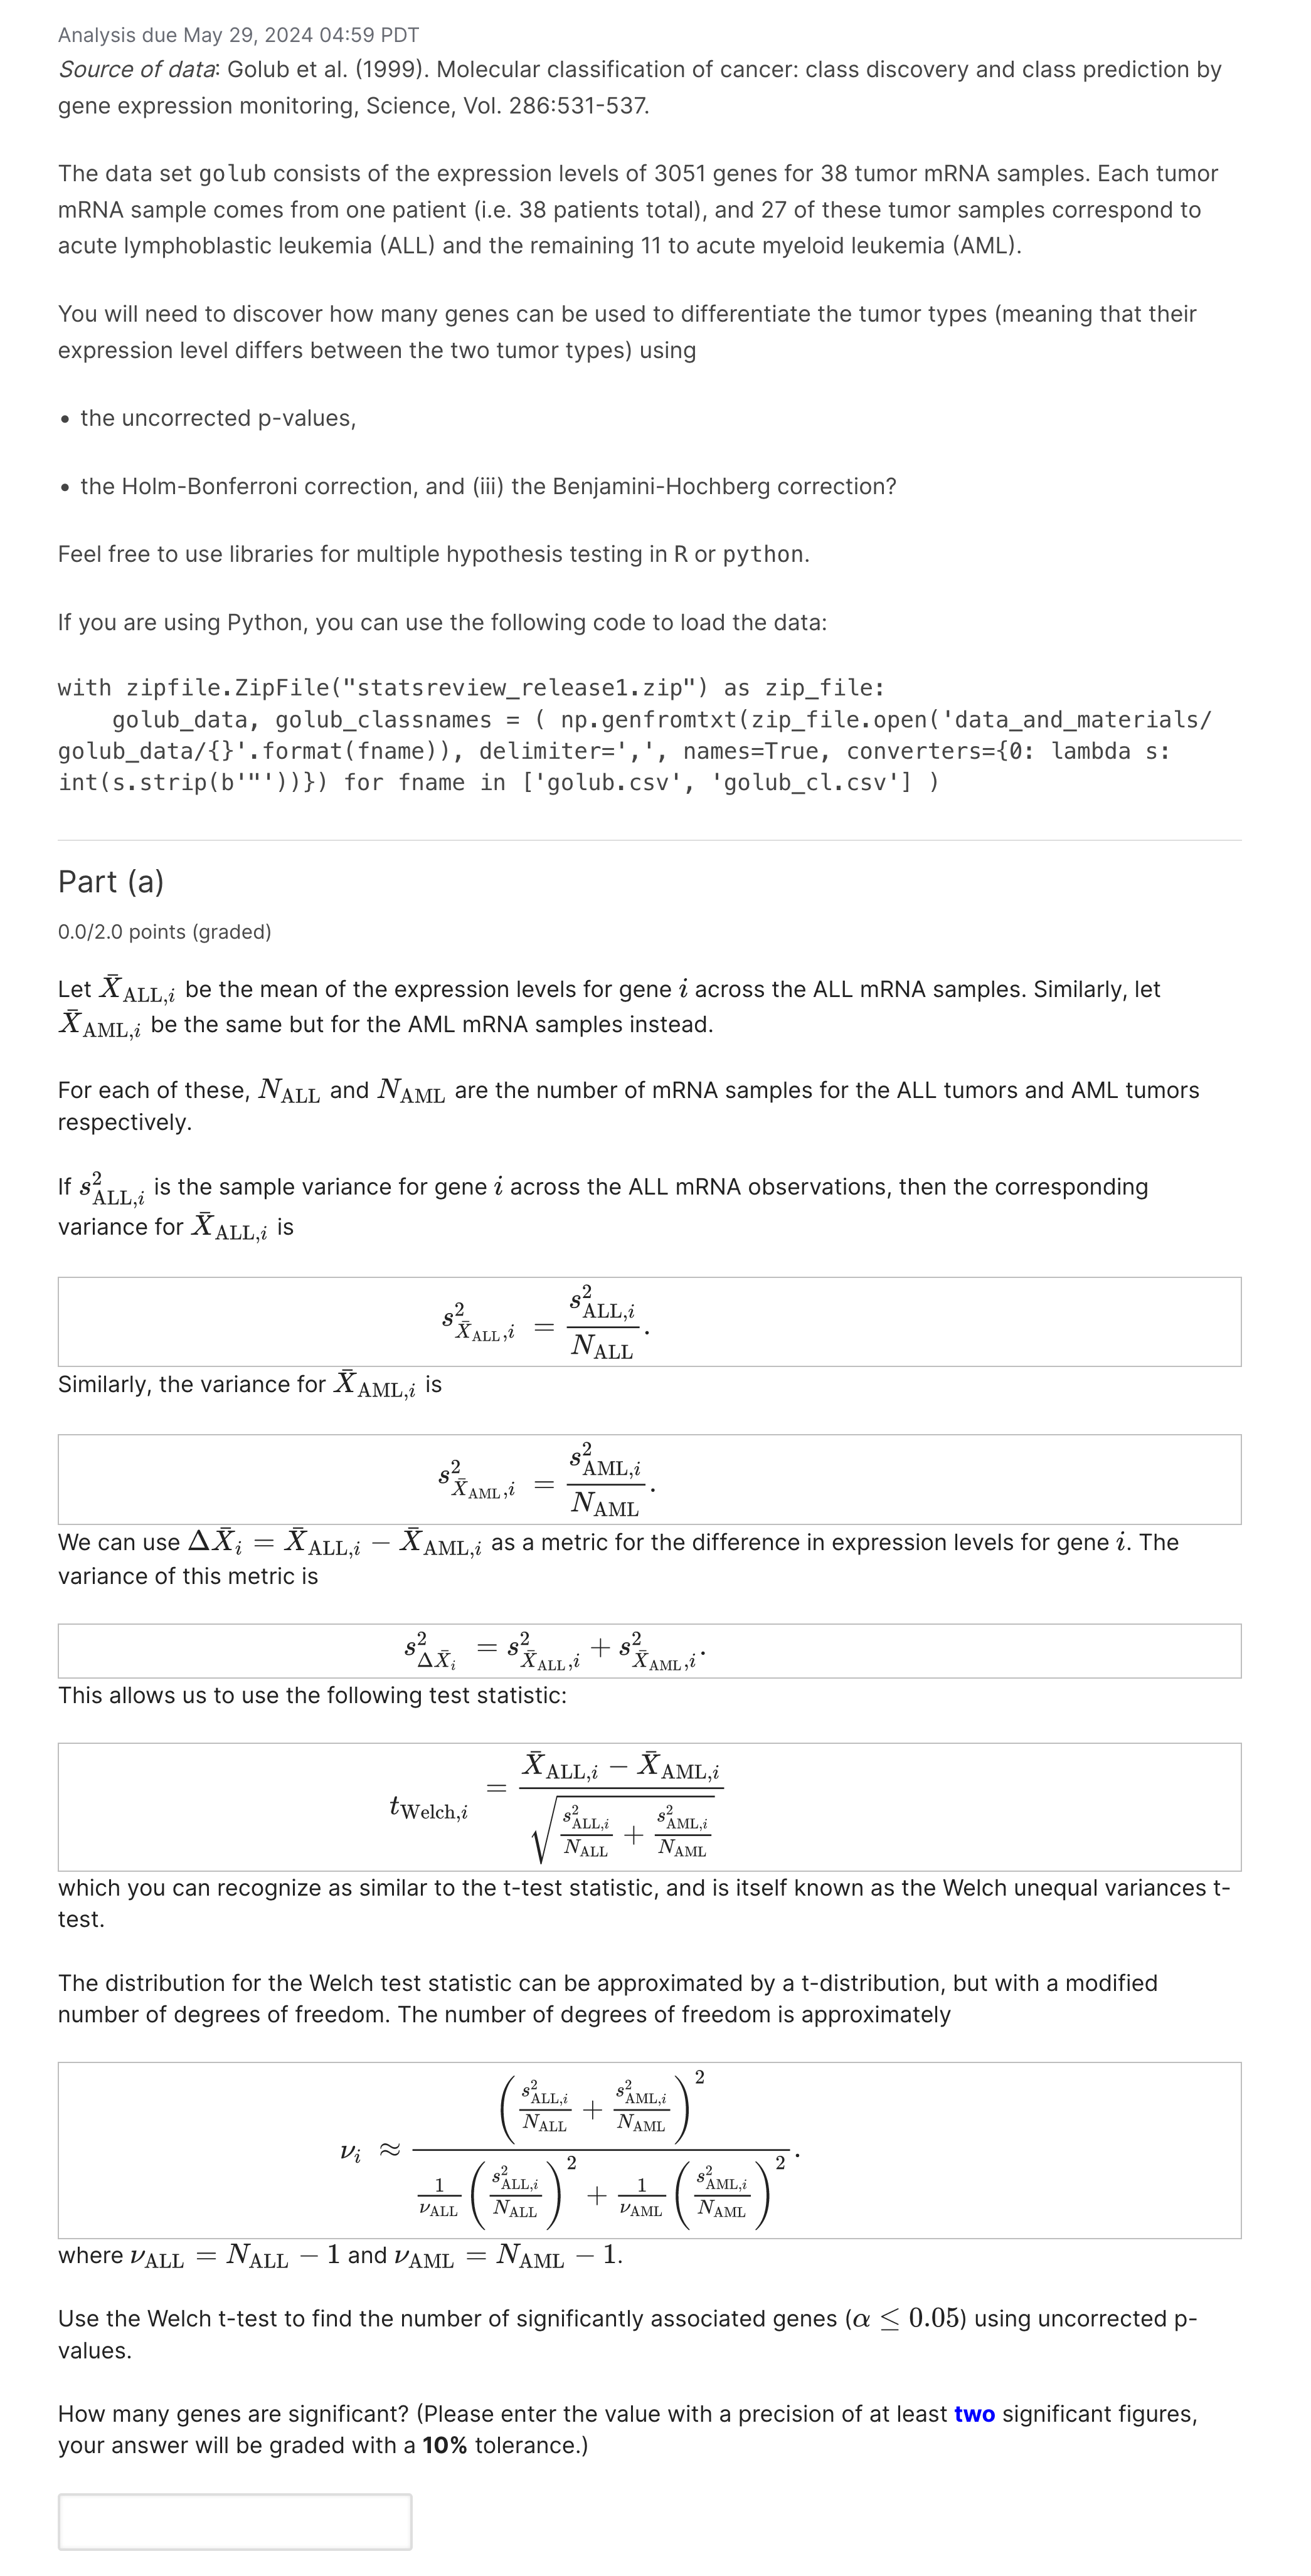
The distribution for the Welch test statistic can be approximated by a tdistribution, but with a modified
number of degrees of freedom. The number of degrees of freedom is approximately
where and
Use the Welch ttest to find the number of significantly associated genes using uncorrected p
values.
How many genes are significant? Please enter the value with a precision of at least two significant figures,
your answer will be graded with a tolerance.
Step by Step Solution
There are 3 Steps involved in it
1 Expert Approved Answer
Step: 1 Unlock

Question Has Been Solved by an Expert!
Get step-by-step solutions from verified subject matter experts
Step: 2 Unlock
Step: 3 Unlock