

Question: Spam Email: Using the email dataset from the openintro package, you are going to write a function that calculates the sampling distribution for the mean
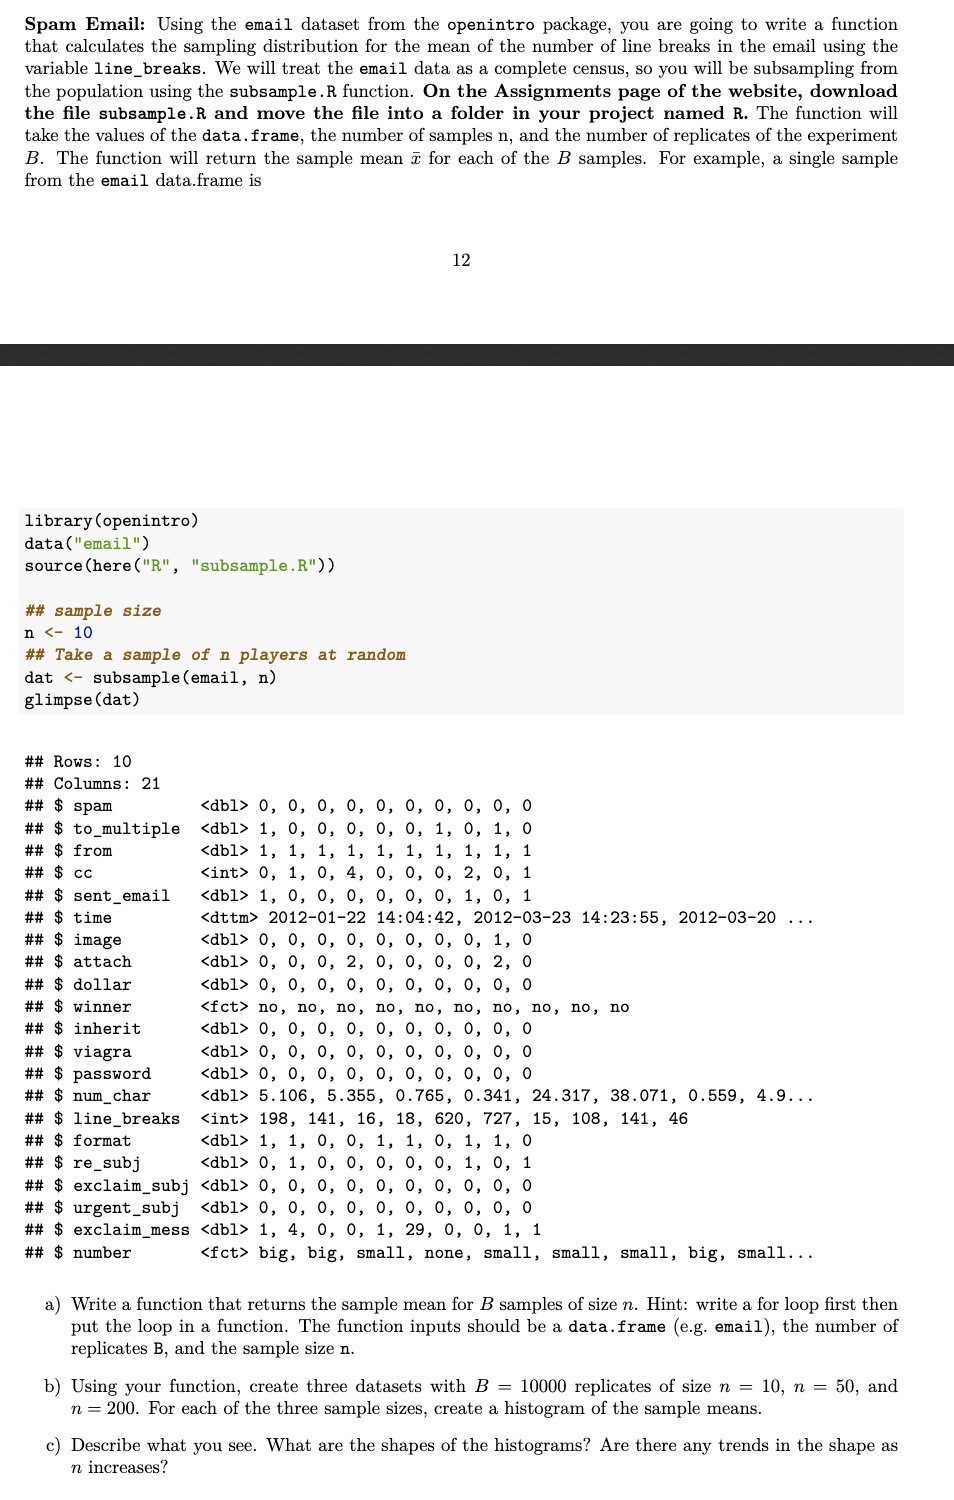
Spam Email: Using the email dataset from the openintro package, you are going to write a function that calculates the sampling distribution for the mean of the number of line breaks in the email using the variable line_breaks. We will treat the email data as a complete census, so you will be subsampling from the population using the subsample. R function. On the Assignments page of the website, download the file subsample.R and move the file into a folder in your project named R. The function will take the values of the data.frame, the number of samples n, and the number of replicates of the experiment B. The function will return the sample mean for each of the B samples. For example, a single sample from the email data.frame is 12 library (openintro) data("email") source (here("R", "subsample.R")) ## sample size n 0, 0, 0, 0, 0, 0, 0, 0, 0, 0 ## $ to_multiple
Step by Step Solution
There are 3 Steps involved in it
Sure Lets go through the steps to achieve this task usi... View full answer

Get step-by-step solutions from verified subject matter experts