

Question: Sparklines (Part 1 - 5 points) Do some research on Excel sparklines. Explain what Sparklines are used for and how to create them in Excel.
Sparklines
(Part 1 - 5 points) Do some research on Excel sparklines. Explain what Sparklines are used for and how to create them in Excel. Be sure to discuss the three different types. (5 points)
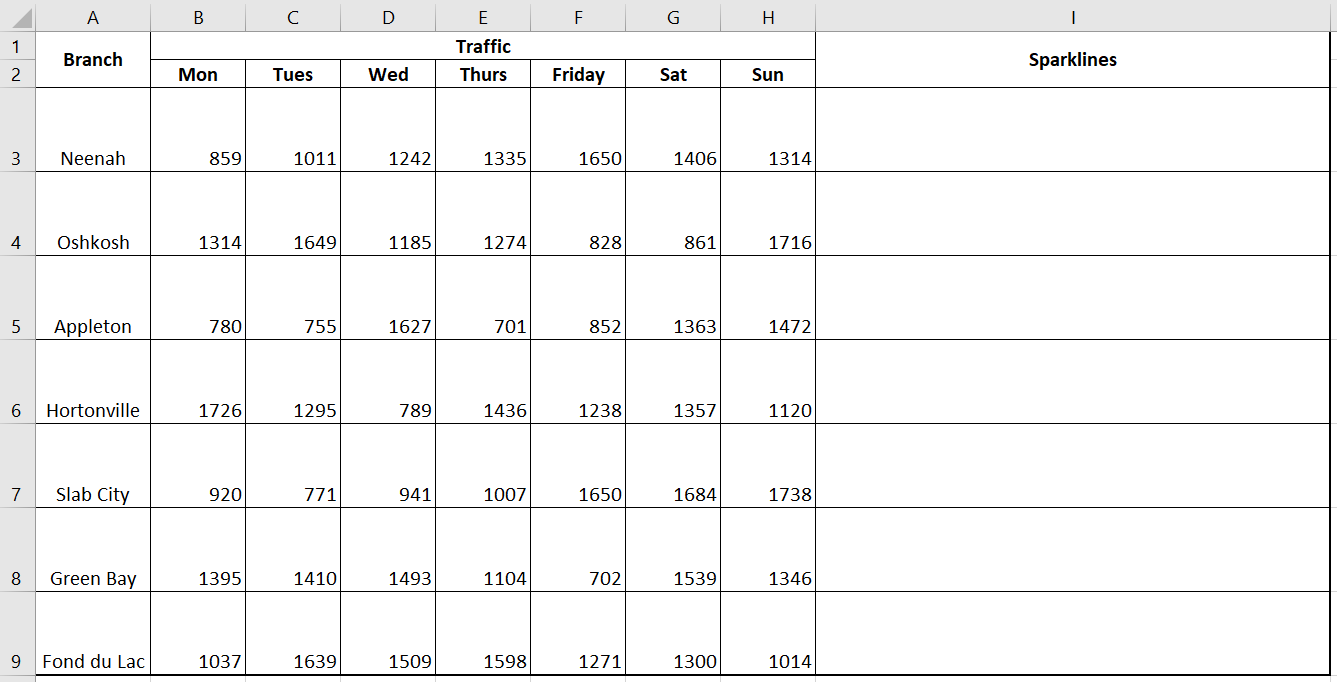
(Part 2 - 5 points) The first tab in the data file (Sparklines) contains customer traffic information for several branches of a bank. Using the data, create line sparklines in cells I3 to I9. Include markers for each point, and make the Sparklines 2 point weight. Copy the whole table (A1:G9), including the Sparklines you created, into your answer document. (5 points)
Bubble Charts
(Part 1 - 5 points) Do some research on Bubble Charts. Explain what bubble charts are used for and how to create them in Excel. Be sure to include advantage(s) bubble charts have over other charts like column and line. (5 points)
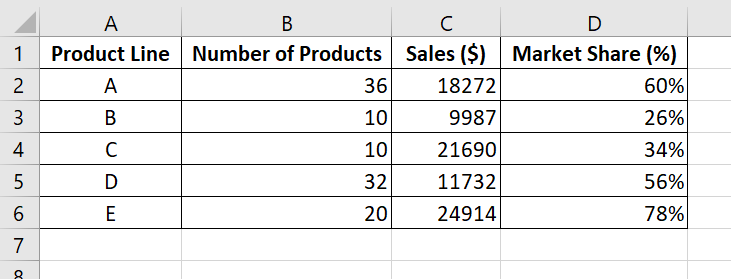
(Part 2 10 points) The second tab in the data file (Bubble Chart) contains information about a product line, including the product line, the number of products in that line, the sales (in $) and the market share (as a percentage of the total market).
Using the data, create a 3-D bubble chart where each bubble represents one product:
- Number of products in the line is the X axis
- Sales is the Y axis
- Market share is represented by the size of the bubbles
Your chart should have a title, labels for the X and Y axis, and labels for each bubble showing which product line it is. You only need to copy the bubble chart (not the data table) into your document.
Notes:
For each Part 1 (Sparklines and Bubble Charts), make sure to cite your sources. You must have at least two (2) sources for each of the part 1s (four (4) sources total) and Wikipedia is not a source!
You do not need to repeat the questions on your answer sheet.
Make sure anything you copy and paste from Excel is completely shown on your hardcopy.
Step by Step Solution
There are 3 Steps involved in it

Get step-by-step solutions from verified subject matter experts