

Question: SPC CHART SELECTION PRACTICE Choose the appropriate control chart for each of the following scenarios. I find it helpful to ask the following questions for
SPC CHART SELECTION PRACTICE
Choose the appropriate control chart for each of the following scenarios. I find it helpful to ask the following questions for each scenario because they help in navigating the decision tree
A) What is the object/unit of interest? (e.g., car, customer)
B) What is being monitored?
C) What data is actually being recorded?
1. Rolls of coiled wire are inspected every hour and the number of defects per roll is recorded.
2. Plastic pipe is being sold in 3-foot lengths.
3. An inspector has counted the number of defective computer chips in each of 20 samples.
4. Sheets of paper are inspected for pinholes, which cause problems for printer customers. If more than 10 holes are counted on a strip of paper, the entire reel of paper is scrapped.
5. On one particular day, an inspector found an average of 3.9 scratches in the exterior paint of each of the automobiles being prepared for shipment to dealers.
6. A lawnmower manufacturer guarantees its product will start in two pulls or less. Before shipping lawnmowers to dealers, an inspector attempts to start each mower and notes any that do not start on the first or second try.
7. Length of time on hold is an important indicator of customer satisfaction for a telephone call center. All calls placed on hold for less than 60 seconds are recorded as satisfactory, while those on hold for more than 60 seconds are recorded as unacceptable.
8. Errors in customer orders can occur in many areas and by different functional areas. An audit of last months orders shows an average of 1.6 errors per order.
9. A company must maintain tight control on the diameter of its drive shafts to ensure the gears fit over them properly.
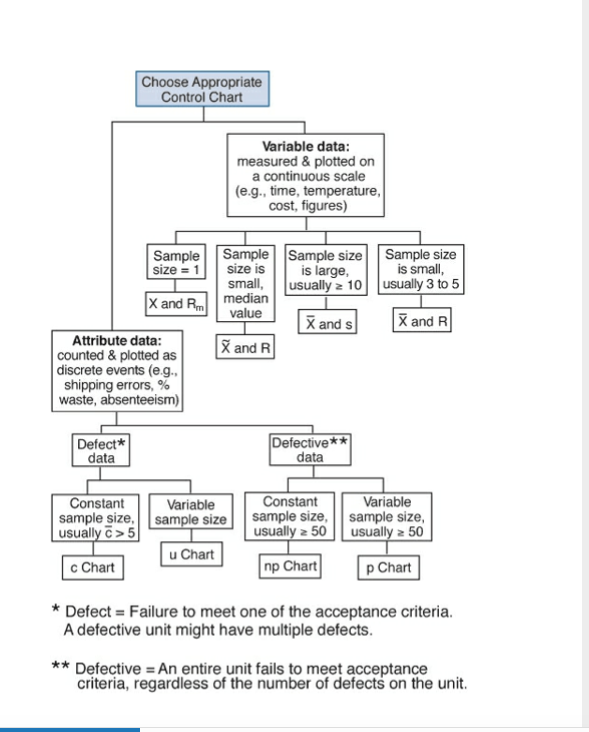
Choose Appropriate Control Chart Variable data: measured & plotted on a continuous scale (e.g., time, temperature, cost, figures) Sample Sample size = 11 size is small, X and RI median value Sample size is large, usually 2 10 Sample size is small, usually 3 to 5 x and en moeder en France and s and R X and R Attribute data: counted & plotted as discrete events (e.g., shipping errors, % waste, absenteeism) Defect* data Defective** data Constant sample size, usually c>5 Variable sample size Constant Variable sample size, sample size, usually 50 || usually a 50 u Chart c Chart np Chart p Chart * Defect = Failure to meet one of the acceptance criteria. A defective unit might have multiple defects. ** Defective =An entire unit fails to meet acceptance criteria, regardless of the number of defects on the unitStep by Step Solution
There are 3 Steps involved in it

Get step-by-step solutions from verified subject matter experts