

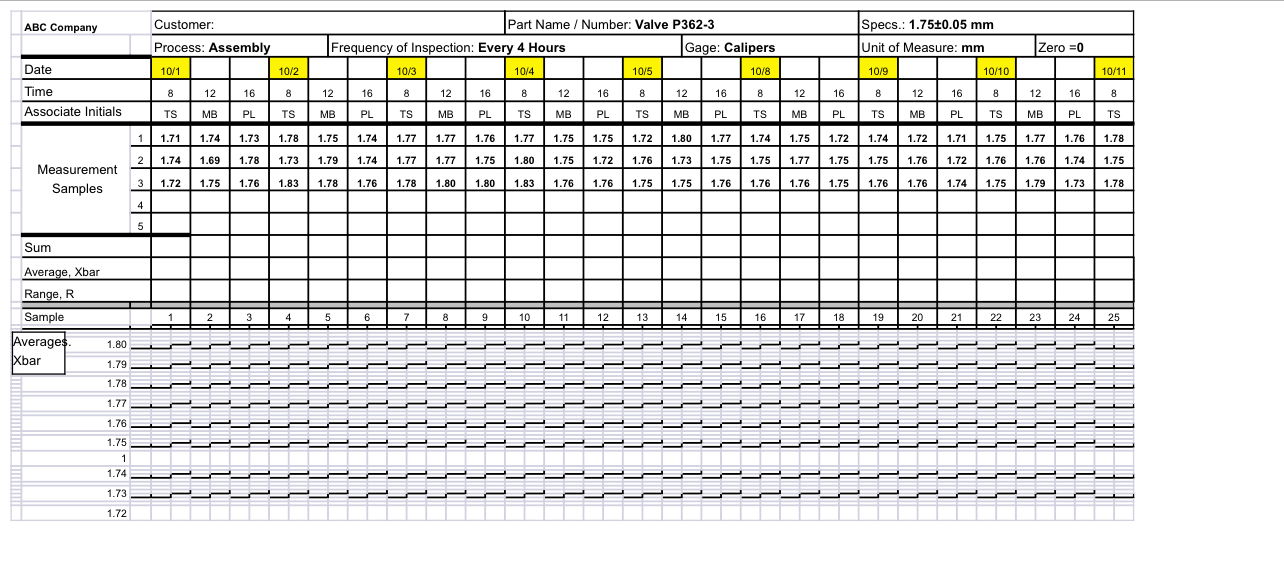
Question: SPC Charting / Capability For the data provided in a separate spreadsheet [ Valve Assembly Clearance ] , please complete the following: Determine centerlines and
SPC Charting Capability
For the data provided in a separate spreadsheet Valve Assembly Clearance please complete
the following:
Determine centerlines and control limits for both the X bar and R charts show your work
Plot the data on the chart with centerline and control limits drawn appropriately
Are there any outofcontrol conditions? If so indicate where they are and the reason why
they are out of control.
Calculate the process capability indices Cp and Cpk Is the process capable? Why or
why not
If the process is normal, what is the fraction outofspecifications assuming the
specifications are
tableABC Company,Customer:,Part Name Number: Valve PSpecs.:
Step by Step Solution
There are 3 Steps involved in it
1 Expert Approved Answer
Step: 1 Unlock

Question Has Been Solved by an Expert!
Get step-by-step solutions from verified subject matter experts
Step: 2 Unlock
Step: 3 Unlock