

Question: Specific ID chart, Weighted average Chart, Fifo Chart and Lifo Chart please Required information [The following information applies to the questions displayed below] Laker Company
Specific ID chart, Weighted average Chart, Fifo Chart and Lifo Chart please
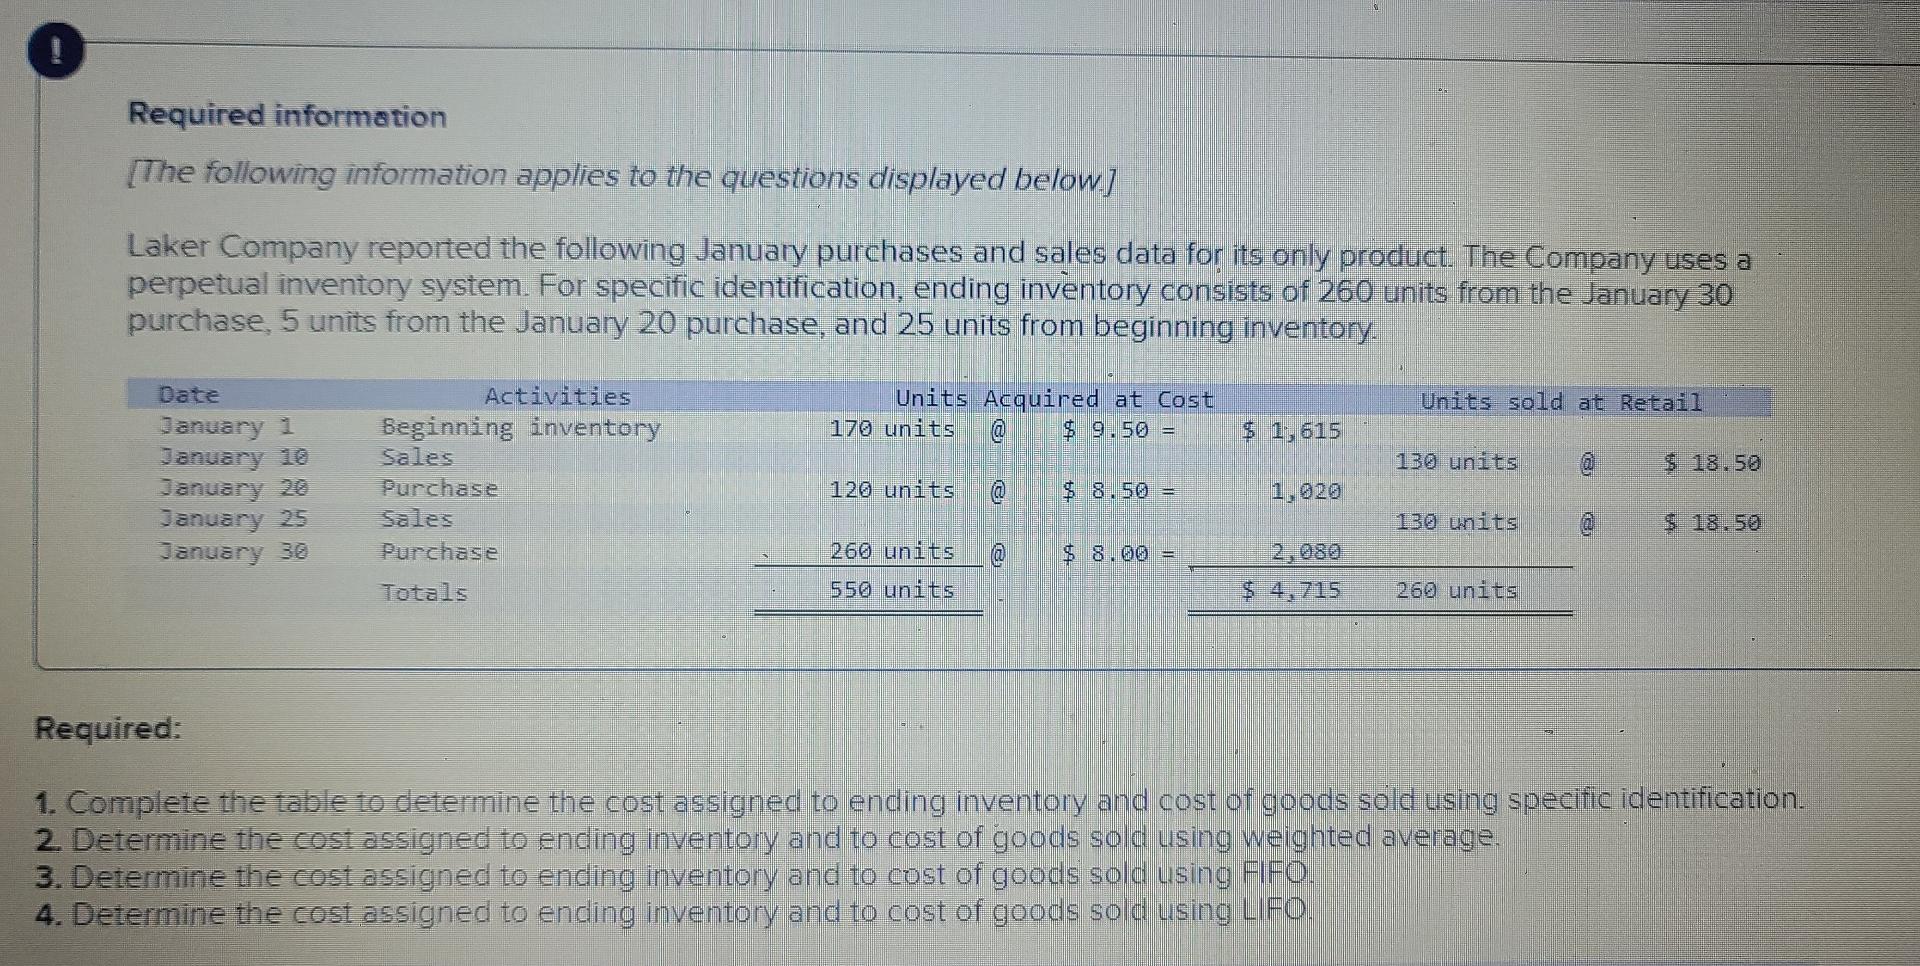
Required information [The following information applies to the questions displayed below] Laker Company reported the following January purchases and sales data for its only product. The Company uses a perpetual inventory system. For specific identification, ending inventory consists of 260 units from the January 30 purchase, 5 units from the January 20 purchase, and 25 units from beginning inventory. Date Units sold at Retail Activities Beginning inventory Sales Units Acquired at Cost $ 9.50 = 170 units $ 1,615 130 units $ 18.5 January 1 January 10 January 20 January 25 January 30 120 units $ 8.50 = 1,020 Purchase Sales 130 units $ 18.50 @ 260 units @ 550 units $ 8.00 = Purchase Totals 2,080 $ 4,715 260 units Required: 1. Complete the table to determine the cost assigned to ending inventory and cost of goods sold using specific identification. 2. Determine the cost assigned to ending inventory and to cost of goods sold using weighted average. 3. Determine the cost assigned to ending inventory and to cost of goods sold using FIFO. 4. Determine the cost assigned to ending inventory and to cost of goods sold using LIFO
Step by Step Solution
There are 3 Steps involved in it

Get step-by-step solutions from verified subject matter experts