

Question: Specific Identification, FIFO, LIFO, and Weighted-Average Swing Company's beginning inventory and purchases during the fiscal year ended September 30, 20-2, were as shown. 500 October
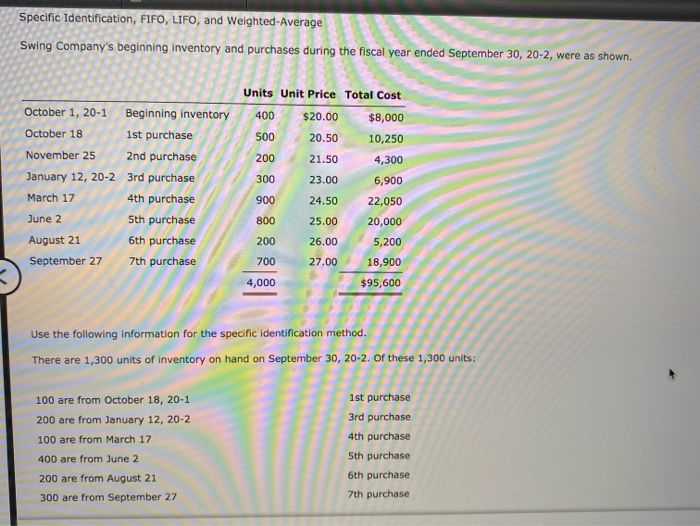
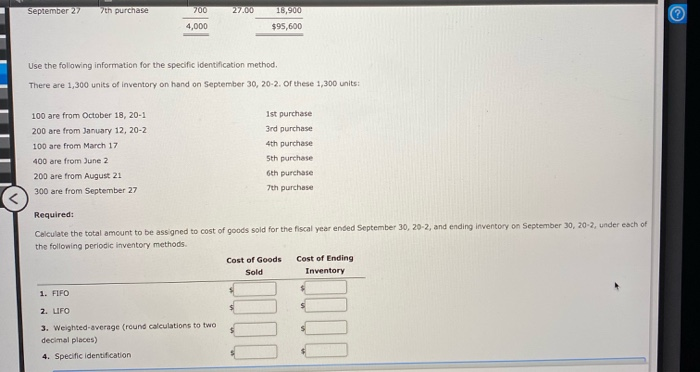
Specific Identification, FIFO, LIFO, and Weighted-Average Swing Company's beginning inventory and purchases during the fiscal year ended September 30, 20-2, were as shown. 500 October 1, 20-1 Beginning inventory October 18 1st purchase November 25 2nd purchase January 12, 20-2 3rd purchase March 17 4th purchase June 2 5th purchase August 21 6th purchase September 27 7th purchase Units Unit Price Total Cost 400 $20.00 $8,000 20.50 10,250 200 21.50 4,300 300 23.00 6,900 900 24.50 22,050 25.00 20,000 200 26.00 5,200 700 27.00 18,900 4,000 $95,600 800 Use the following information for the specific identification method. There are 1,300 units of inventory on hand on September 30, 20-2. Of these 1,300 units: 100 are from October 18, 20-1 200 are from January 12, 20-2 100 are from March 17 400 are from June 2 1st purchase 3rd purchase 4th purchase 5th purchase 6th purchase 7th purchase 200 are from August 21 300 are from September 27 September 27 7th purchase 27.00 16,900 $95,600 4,000 Use the following information for the specific identification method. There are 1,300 units of inventory on hand on September 30, 20-2. of these 1,300 units: 100 are from October 18, 20-1 200 are from January 12, 20-2 100 are from March 17 400 are from June 2 200 are from August 21 300 are from September 27 1st purchase 3rd purchase 4th purchase 5th purchase 6th purchase 7th purchase Required: Calculate the total amount to be assigned to cost of goods sold for the fiscal year ended September 30, 20-2, and ending inventory on September 30, 20-2, under each of the following periodic inventory methods Cost of Goods Cost of Ending Sold Inventory 1. FIFO 2. UFO 3. Weighted average (round calculations to two decimal places) 4. Specific identification
Step by Step Solution
There are 3 Steps involved in it
Swing Company Inventory Calculations Given Data Description Units Unit Cost Total Cost Beginning Inventory 400 2000 8000 Oct 18 1st 500 2050 10250 Nov 25 2nd 200 2150 4300 Jan 12 3rd 300 2300 6900 Mar 17 4th 900 2450 22050 Jun 2 5th 800 2500 20000 Aug 21 6th 200 2600 5200 Sep 27 7th 700 2700 18900 Total 4000 95600 Units on hand 1300 Units sold 4000 1300 2700 1 Specific Identification Given ending inventory units 100 Oct 18 2050 200 Jan 12 2300 100 Mar 17 2450 400 Jun 2 2500 200 Aug 21 2600 300 Sep 27 2700 Ending Inventory 100 x 2050 2050 200 x 2300 4600 100 x 2450 2450 400 x 2500 10000 200 x 2600 5200 300 x 2700 8100 Total EI 32400 Cost of Goods Sold COGS Total Cost Ending Inventory COGS 95600 32400 63200 2 FIFO Ending Inventory Last 1300 units Sep 27 700 x 27 18900 Aug 21 200 x 26 5200 Jun 2 400 x 25 10000 Total EI FIFO 34100 COGS FIFO COGS 95600 34100 61500 3 LIFO Ending Inventory First 1300 units Beginning Inv ... View full answer

Get step-by-step solutions from verified subject matter experts