

Question: Specific: Introduction to Operations Research Assignment Problem Set Solve Problem 21-8, on page 58. Use Excel worksheet to reproduce figure A.2 on page 1187, by
Specific:
Introduction to Operations Research Assignment Problem Set
- Solve Problem 21-8, on page 58.
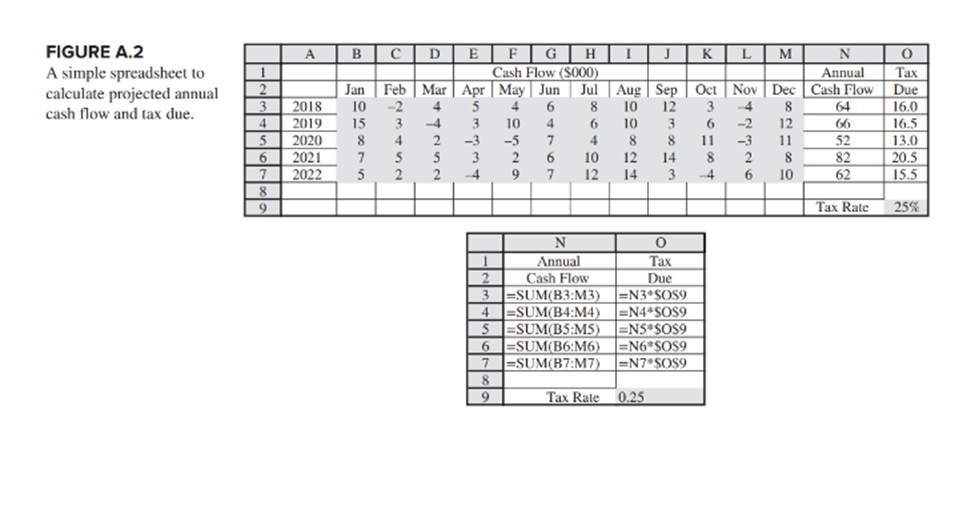
- Use Excel worksheet to reproduce figure A.2 on page 1187, by doing the following:
- Enter the data given
- For each year, use the formula bar to calculate the Annual Cash Flow and Tax Due and then the Tax Rate
- Apply border, color and shading to differentiate each year, Annual Cash flow column, Tax due column and the Tax Rate section
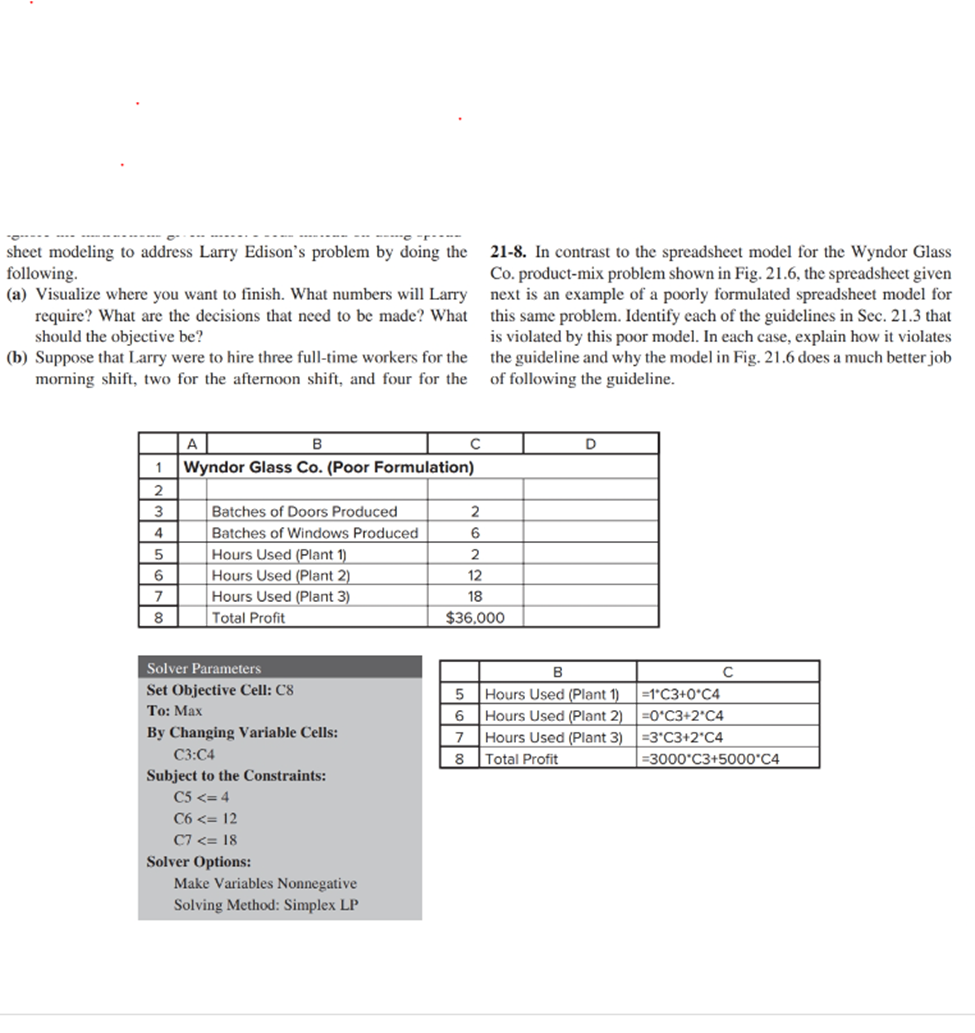
sheet modeling to address Larry Edison's problem by doing the following. (a) Visualize where you want to finish. What numbers will Larry require? What are the decisions that need to be made? What should the objective be? (b) Suppose that Larry were to hire three full-time workers for the morning shift, two for the afternoon shift, and four for the 21-8. In contrast to the spreadsheet model for the Wyndor Glass Co. product-mix problem shown in Fig. 21.6, the spreadsheet given next is an example of a poorly formulated spreadsheet model for this same problem. Identify each of the guidelines in Sec. 21.3 that is violated by this poor model. In each case, explain how it violates the guideline and why the model in Fig. 21.6 does a much better job of following the guideline. FIGURE A.2 A simple spreadsheet to calculate projected annual cash flow and tax due
Step by Step Solution
There are 3 Steps involved in it

Get step-by-step solutions from verified subject matter experts