

Question: Specifications on a normally distributed dimension are 600 + 20. X_bar and R charts are maintained on this dimension and have been in control over
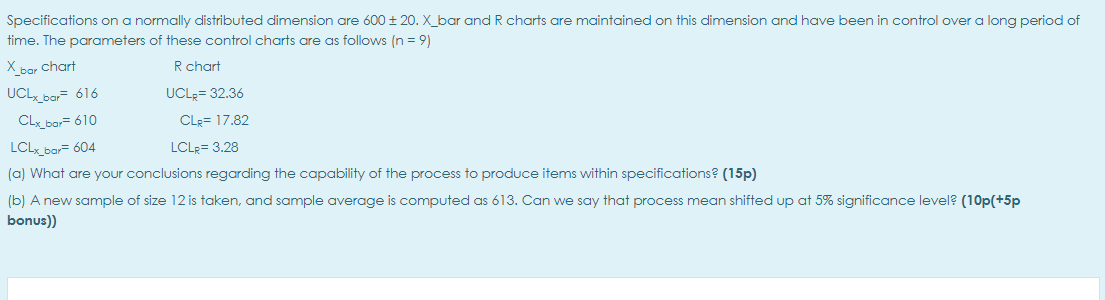
Specifications on a normally distributed dimension are 600 + 20. X_bar and R charts are maintained on this dimension and have been in control over a long period of time. The parameters of these control charts are as follows (n = 9) Rchart Xbor chart UCLx_bor= 616 CLx_bor= 610 UCLR= 32.36 CLR= 17.82 LCLx_bar= 604 LCLR= 3.28 (a) What are your conclusions regarding the capability of the process to produce items within specifications? (15p) (b) A new sample of size 12 is taken, and sample average is computed as 613. Can we say that process mean shifted up at 5% significance level? (10p(+5p bonus))
Step by Step Solution
There are 3 Steps involved in it
1 Expert Approved Answer
Step: 1 Unlock

Question Has Been Solved by an Expert!
Get step-by-step solutions from verified subject matter experts
Step: 2 Unlock
Step: 3 Unlock