

Question: Specilications for a part for a 3.D peinter state thet the port should weigh between 24.2 and 25.2 ounces. The process that produces the parts
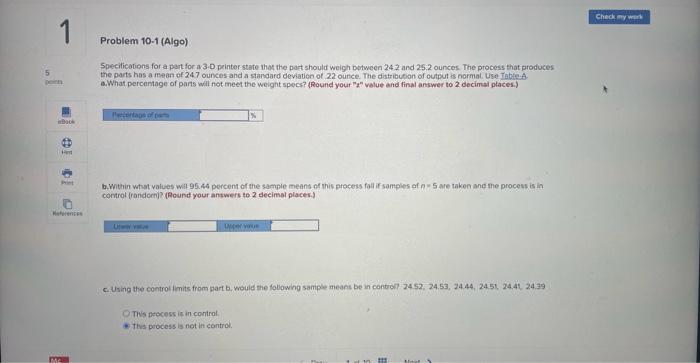
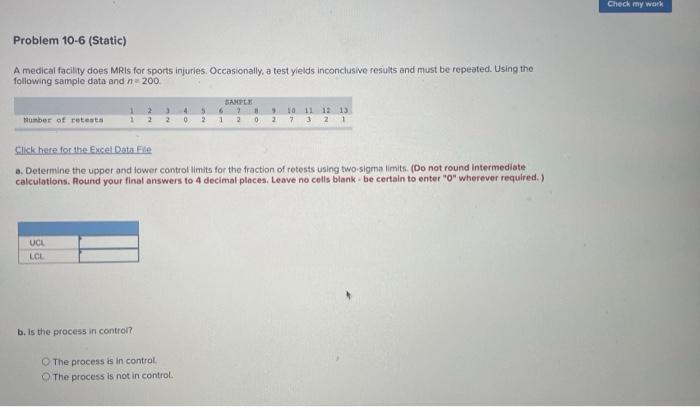
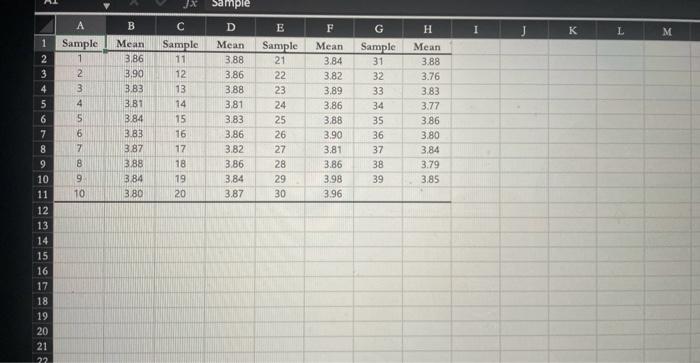
Specilications for a part for a 3.D peinter state thet the port should weigh between 24.2 and 25.2 ounces. The process that produces the parts has a mean of 247 ounces and a standard deviation of 22 ounce. The distribution of output is cormat. Use Table. A a. What percentage of parts will not meet the weight specs? (Round your " 2 " walue and final answer to 2 decimal places.) b. Within whot values will 95.44 percent of the sample means of this process fall if samples of a =5 are taken and the process is in controt (randorn)? (Round your answers to 2 decimal places.) c. Using the control imits from part b. would the following sample means be in contec? 2452,24.53,24.44,24.51,24.41,24.39 This peocess in in control This peocess is not in control. A medical facility does MRis for sports injuries. Occasionally, a test yields inconclusive results and must be repeated. Using the following sample data and n=200. Click here for the Excel Datn File a. Determine the upper and lower control limits for the fraction of retests using two-sigma limits. (Do not round intermediate calculations. Round your final answers to 4 decimal places, Leave no cells blank - be certain to enter " 0 " wherever required.) b. Is the process in contron? The process is in control. The process is not in control. \begin{tabular}{|c|c|c|c|c|c|c|c|c|} \hline & A & B & C & D & E & F & G & H \\ \hline 1 & Sample & Mean & Sample & Mean & Sample & Mean & Sample & Mean \\ \hline 2 & 1 & 3.86 & 11 & 3.88 & 21 & 3.84 & 31 & 3.88 \\ \hline 3 & 2 & 3.90 & 12 & 3.86 & 22 & 3.82 & 32 & 3.76 \\ \hline 4 & 3 & 3.83 & 13 & 3.88 & 23 & 3.89 & 33 & 3.83 \\ \hline 5 & 4 & 3.81 & 14 & 3.81 & 24 & 3.86 & 34 & 3.77 \\ \hline 6 & 5 & 3.84 & 15 & 3.83 & 25 & 3.88 & 35 & 3.86 \\ \hline 7 & 6 & 3.83 & 16 & 3.86 & 26 & 3.90 & 36 & 3.80 \\ \hline 8 & 7 & 3.87 & 17 & 3.82 & 27 & 3.81 & 37 & 3.84 \\ \hline 9 & 8 & 3.88 & 18 & 3.86 & 28 & 3.86 & 38 & 3.79 \\ \hline 10 & 9 & 3.84 & 19 & 3.84 & 29 & 3.98 & 39 & 3.85 \\ \hline 11 & 10 & 3.80 & 20 & 3.87 & 30 & 3.96 & & \\ \hline \end{tabular}
Step by Step Solution
There are 3 Steps involved in it

Get step-by-step solutions from verified subject matter experts