

Question: Spectrophotometry Homework A ) Plot the Standard Curve for the Maltose Determination Assay ( I ) . Make sure to label your graph appropriately and
Spectrophotometry Homework
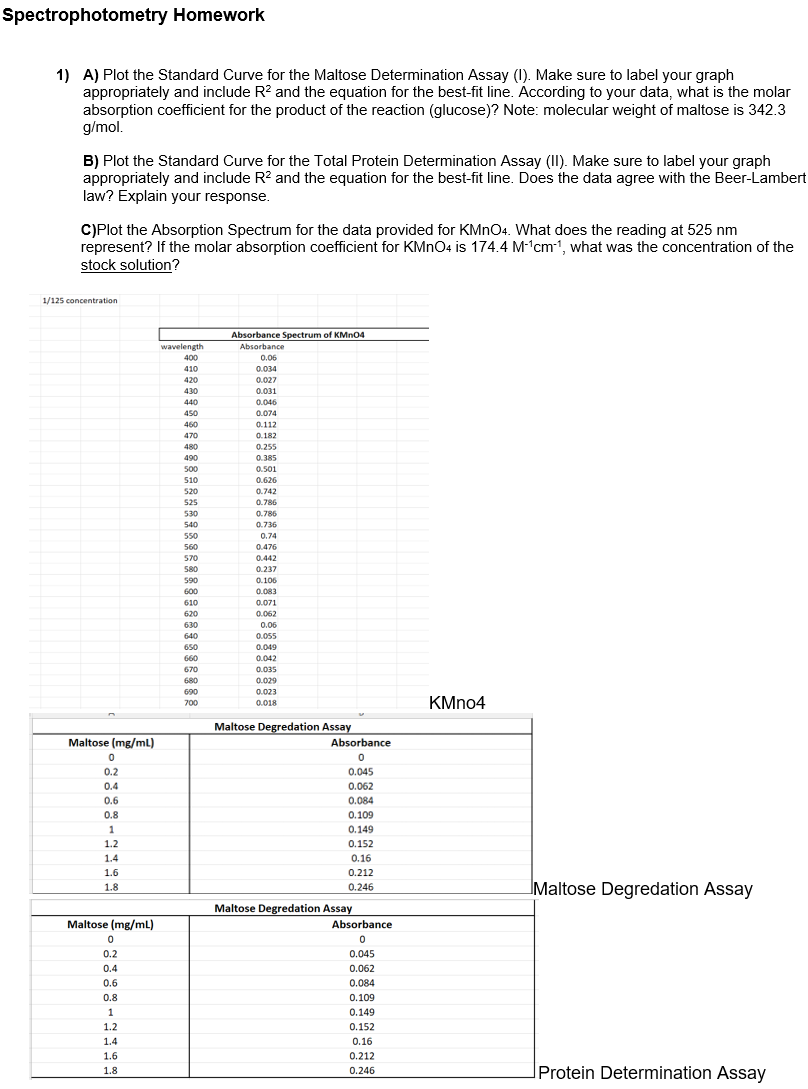
A Plot the Standard Curve for the Maltose Determination Assay I Make sure to label your graph
appropriately and include and the equation for the bestfit line. According to your data, what is the molar
absorption coefficient for the product of the reaction glucose Note: molecular weight of maltose is
B Plot the Standard Curve for the Total Protein Determination Assay II Make sure to label your graph
appropriately and include and the equation for the bestfit line. Does the data agree with the BeerLambert
law? Explain your response.
CPlot the Absorption Spectrum for the data provided for What does the reading at
represent? If the molar absorption coefficient for is what was the concentration of the
stock solution?
Step by Step Solution
There are 3 Steps involved in it
1 Expert Approved Answer
Step: 1 Unlock

Question Has Been Solved by an Expert!
Get step-by-step solutions from verified subject matter experts
Step: 2 Unlock
Step: 3 Unlock