

Question: Spreadsheet Exercises 8-1 Closing prices for SilTech and New Mines for the years 19972012 are shown below a. Calculate the total returns for each stock
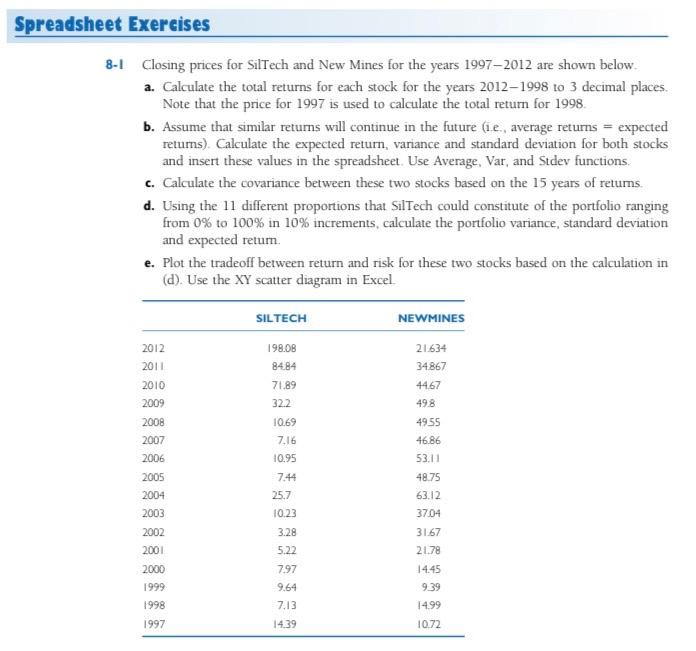
Spreadsheet Exercises 8-1 Closing prices for SilTech and New Mines for the years 19972012 are shown below a. Calculate the total returns for each stock for the years 2012 1998 to 3 decimal places. Note that the price for 1997 is used to calculate the total return for 1998 b. Assume that similar returns will continue in the future i.e. average returns = expected retums). Calculate the expected return, variance and standard deviation for both stocks and insert these values in the spreadsheet. Use Average, Var, and Stdev functions c. Calculate the covariance between these two stocks based on the 15 years of retums. d. Using the 11 different proportions that SilTech could constitute of the portfolio ranging from 0% to 100% in 10% increments, calculate the portfolio variance, standard deviation and expected retum e. Plot the tradeoff between return and risk for these two stocks based on the calculation in (d). Use the XY scatter diagram in Excel SILTECH NEWMINES 2012 2011 2010 2009 2008 2007 2006 198.0B 84.84 71.89 322 10.69 7.16 10.95 7.44 25.7 10.23 3.28 5.22 7.97 9.64 7.13 21.634 34867 4467 49.8 49.55 46.86 53.11 48.75 63.12 3704 31.67 2178 14.45 9.39 2005 2004 2003 2002 2001 2000 1999 1998 1997 14.99 10.72 14.39
Step by Step Solution
There are 3 Steps involved in it

Get step-by-step solutions from verified subject matter experts