

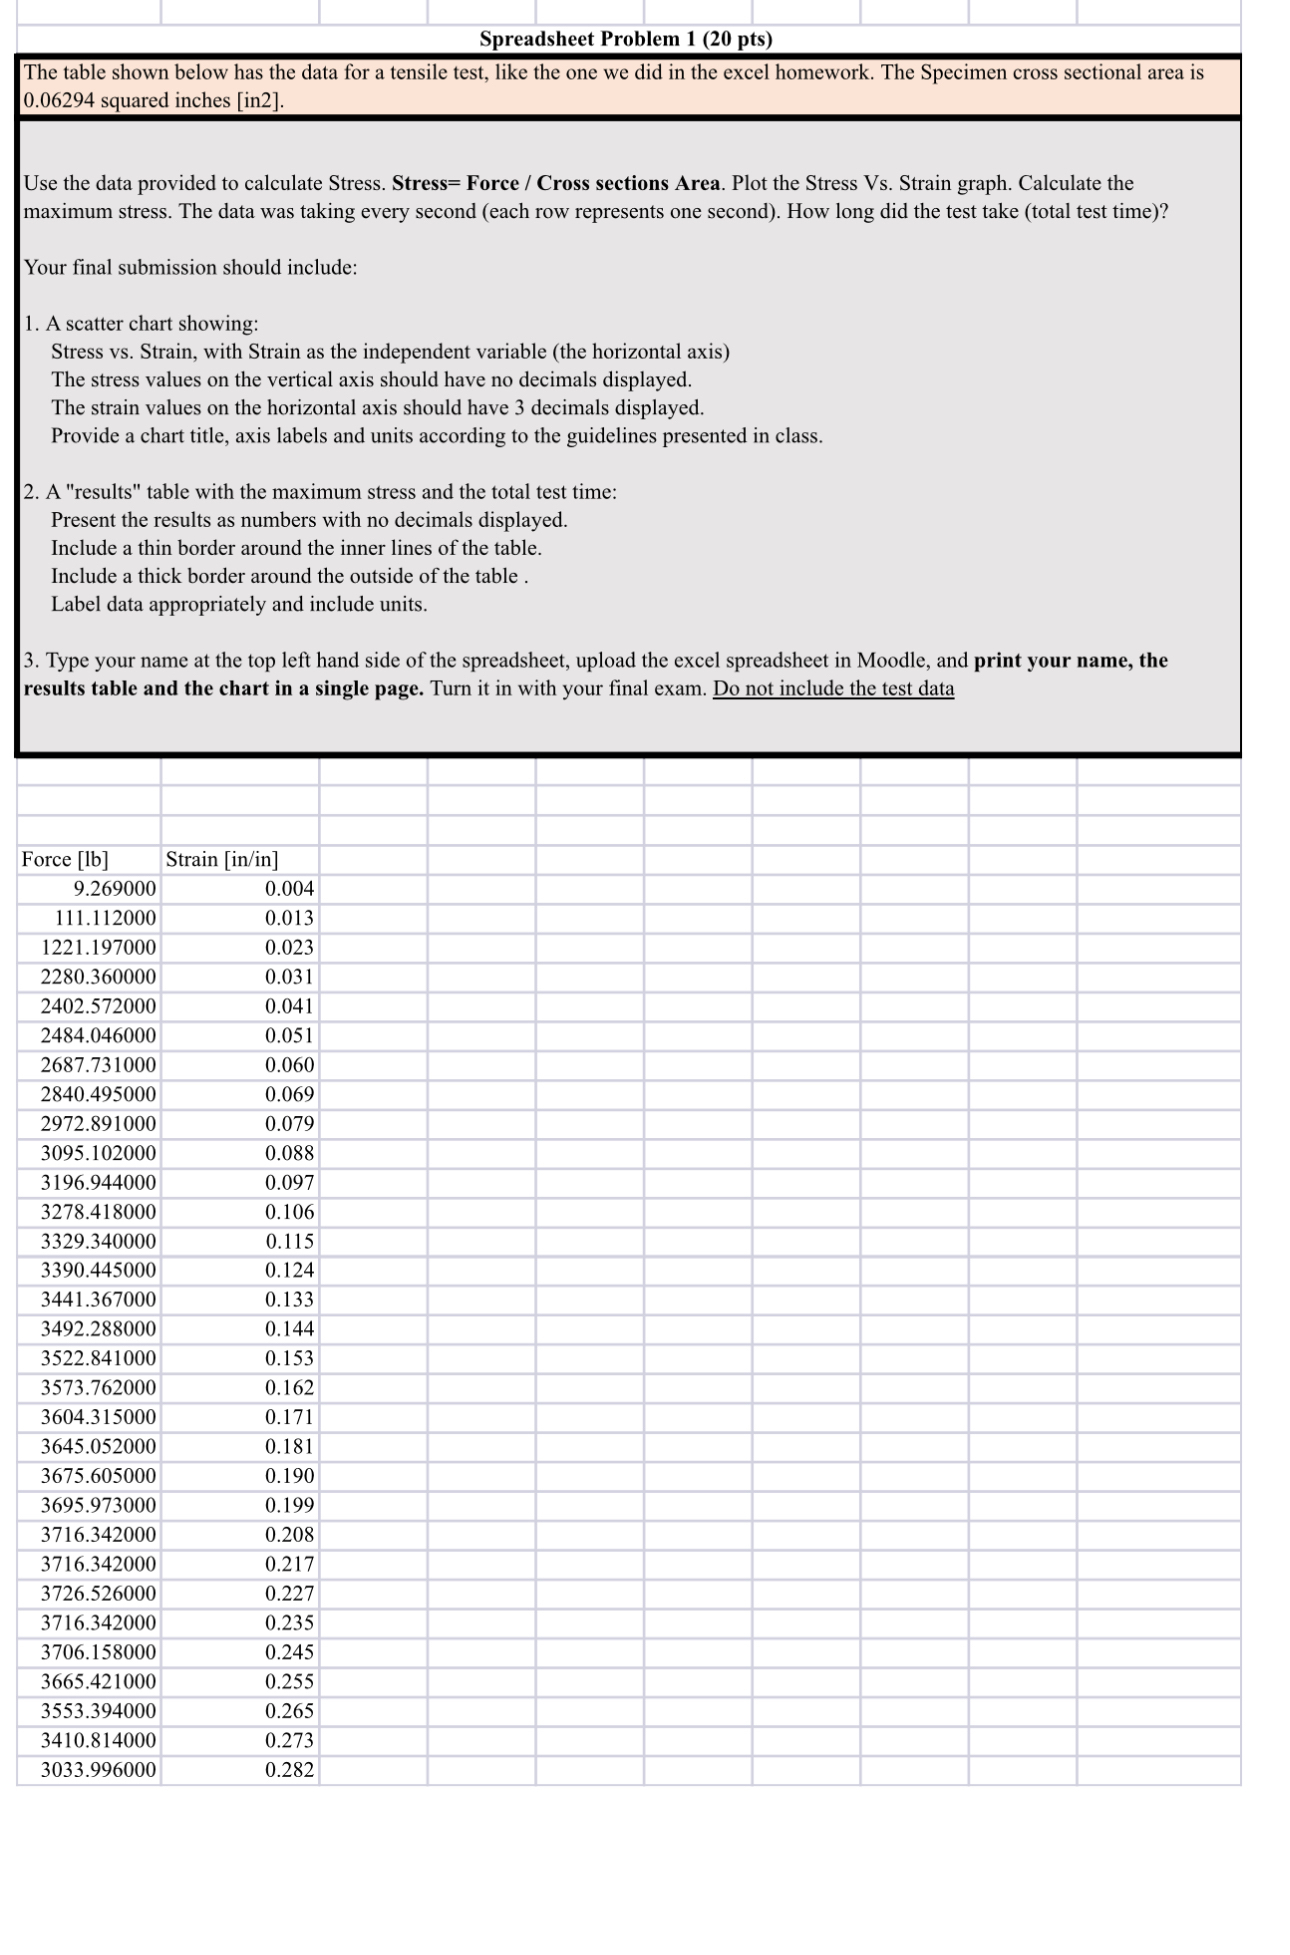
Question: Spreadsheet Problem 1 ( 2 0 pts ) The table shown below has the data for a tensile test, like the one we did in
Spreadsheet Problem pts
The table shown below has the data for a tensile test, like the one we did in the excel homework. The Specimen cross sectional area is squared inches in
Use the data provided to calculate Stress. Stress Force Cross sections Area. Plot the Stress Vs Strain graph. Calculate the maximum stress. The data was taking every second each row represents one second How long did the test take total test time
Your final submission should include:
A scatter chart showing:
Stress vs Strain, with Strain as the independent variable the horizontal axis
The stress values on the vertical axis should have no decimals displayed.
The strain values on the horizontal axis should have decimals displayed.
Provide a chart title, axis labels and units according to the guidelines presented in class.
A "results" table with the maximum stress and the total test time:
Present the results as numbers with no decimals displayed.
Include a thin border around the inner lines of the table.
Include a thick border around the outside of the table
Label data appropriately and include units.
Type your name at the top left hand side of the spreadsheet, upload the excel spreadsheet in Moodle, and print your name, the results table and the chart in a single page. Turn it in with your final exam. Do not include the test data
Step by Step Solution
There are 3 Steps involved in it
1 Expert Approved Answer
Step: 1 Unlock

Question Has Been Solved by an Expert!
Get step-by-step solutions from verified subject matter experts
Step: 2 Unlock
Step: 3 Unlock