

Question: SPSS Problem Set #1 - Frequency Distribution & Descriptive Statistics We use descriptive statistics to organize and summarize data. We can generate single numbers
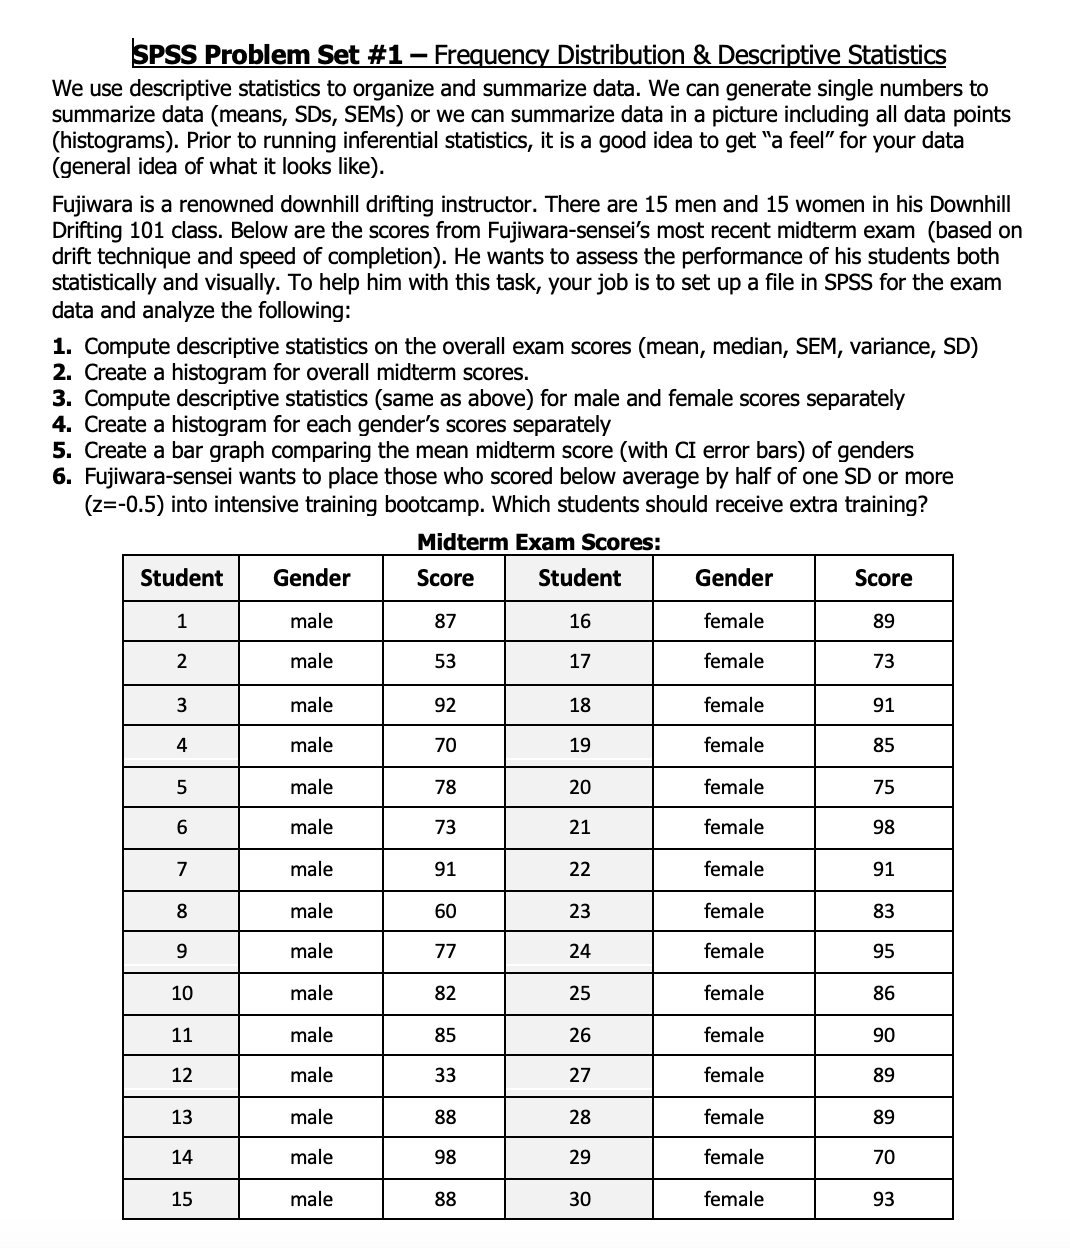
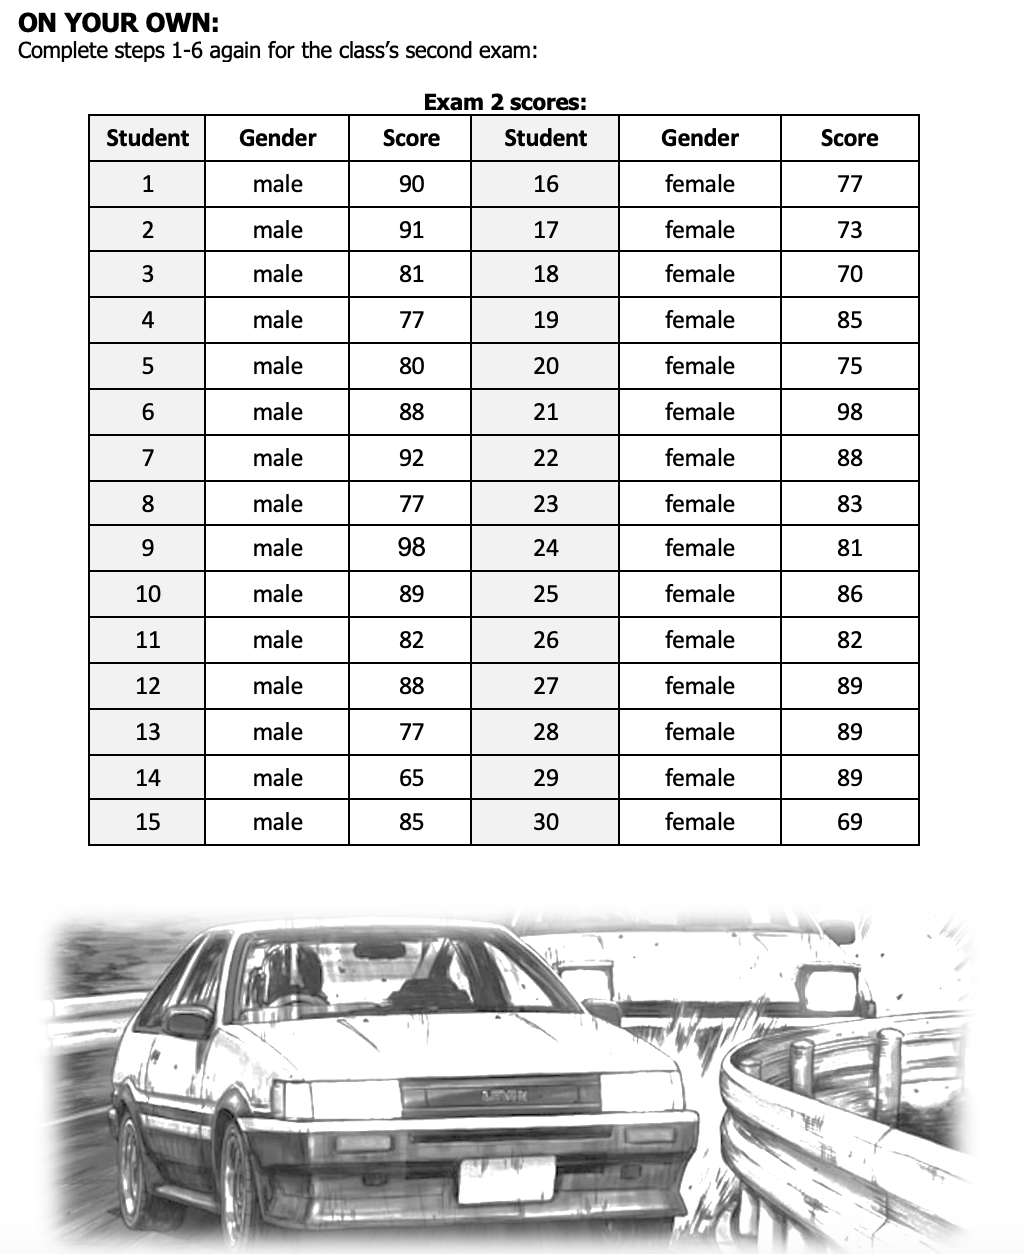
SPSS Problem Set #1 - Frequency Distribution & Descriptive Statistics We use descriptive statistics to organize and summarize data. We can generate single numbers to summarize data (means, SDS, SEMs) or we can summarize data in a picture including all data points (histograms). Prior to running inferential statistics, it is a good idea to get "a feel" for your data (general idea of what it looks like). Fujiwara is a renowned downhill drifting instructor. There are 15 men and 15 women in his Downhill Drifting 101 class. Below are the scores from Fujiwara-sensei's most recent midterm exam (based on drift technique and speed of completion). He wants to assess the performance of his students both statistically and visually. To help him with this task, your job is to set up a file in SPSS for the exam data and analyze the following: 1. Compute descriptive statistics on the overall exam scores (mean, median, SEM, variance, SD) 2. Create a histogram for overall midterm scores. 3. Compute descriptive statistics (same as above) for male and female scores separately 4. Create a histogram for each gender's scores separately 5. Create a bar graph comparing the mean midterm score (with CI error bars) of genders 6. Fujiwara-sensei wants to place those who scored below average by half of one SD or more (z=-0.5) into intensive training bootcamp. Which students should receive extra training? Midterm Exam Scores: Student Gender Score Student Gender Score 1 male 87 16 female 89 2 male 53 17 female 73 3 male 92 18 female 91 4 male 70 19 female 85 5 male 78 20 female 75 6 male 73 21 female 98 7 male 91 22 female 91 8 male 60 23 female 83 9 male 77 24 female 95 10 male 82 25 female 86 11 male 85 26 female 90 12 male 33 27 female 89 13 male 88 28 female 89 14 male 98 29 female 70 15 male 88 30 female 93 ON YOUR OWN: Complete steps 1-6 again for the class's second exam: Exam 2 scores: Student Gender Score Student Gender Score 1 male 90 16 female 77 2 male 91 17 female 73 3 male 81 18 female 70 4 male 77 19 female 85 5 male 80 20 female 75 6 male 88 21 female 98 7 male 92 22 female 88 8 male 77 23 female 83 9 male 98 24 female 81 10 male 89 25 female 86 11 male 82 26 female 82 12 male 88 27 female 89 13 male 77 28 female 89 14 male 65 29 female 89 15 male 85 30 female 69 LIVER
Step by Step Solution
There are 3 Steps involved in it

Get step-by-step solutions from verified subject matter experts