

SPSS Project #2 The goal of this second SPSS project is to learn how to run...
Fantastic news! We've Found the answer you've been seeking!
Question:
Transcribed Image Text:
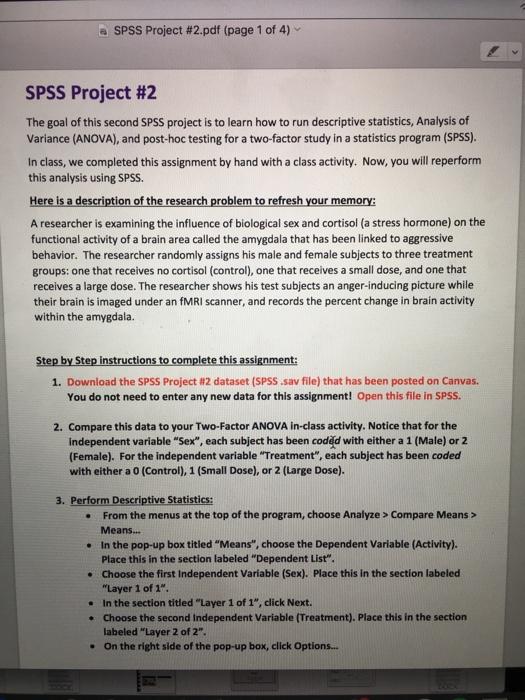
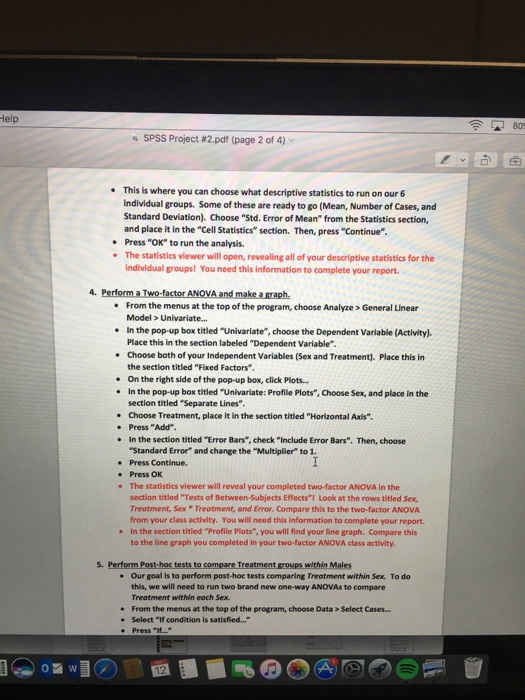
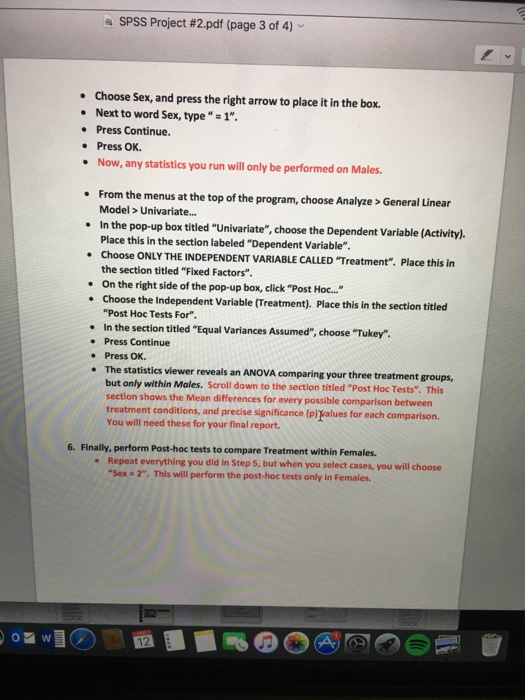
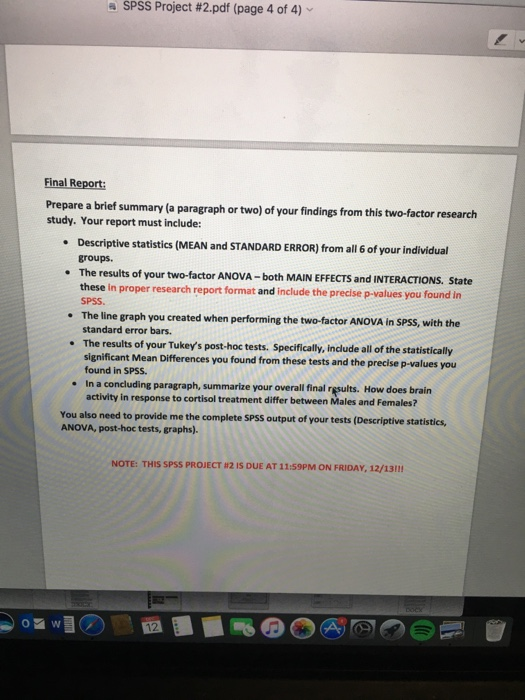
SPSS Project #2 The goal of this second SPSS project is to learn how to run descriptive statistics, Analysis of Variance (ANOVA), and post-hoc testing for a two-factor study in a statistics program (SPSS). In class, we completed this assignment by hand with a class activity. Now, you will reperform this analysis using SPSS. SPSS Project #2.pdf (page 1 of 4) ✓ Here is a description of the research problem to refresh your memory: A researcher is examining the influence of biological sex and cortisol (a stress hormone) on the functional activity of a brain area called the amygdala that has been linked to aggressive behavior. The researcher randomly assigns his male and female subjects to three treatment groups: one that receives no cortisol (control), one that receives a small dose, and one that receives a large dose. The researcher shows his test subjects an anger-inducing picture while their brain is imaged under an fMRI scanner, and records the percent change in brain activity within the amygdala. Step by Step instructions to complete this assignment: 1. Download the SPSS Project #2 dataset (SPSS .sav file) that has been posted on Canvas. You do not need to enter any new data for this assignment! Open this file in SPSS. 2. Compare this data to your Two-Factor ANOVA in-class activity. Notice that for the independent variable "Sex", each subject has been coded with either a 1 (Male) or 2 (Female). For the independent variable "Treatment", each subject has been coded with either a 0 (Control), 1 (Small Dose), or 2 (Large Dose). 3. Perform Descriptive Statistics: mock. From the menus at the top of the program, choose Analyze > Compare Means > Means... • In the pop-up box titled "Means", choose the Dependent Variable (Activity). Place this in the section labeled "Dependent List". • Choose the first Independent Variable (Sex). Place this in the section labeled "Layer 1 of 1". . In the section titled "Layer 1 of 1", click Next. Choose the second Independent Variable (Treatment). Place this in the section labeled "Layer 2 of 2". . On the right side of the pop-up box, click Options... . Help W SPSS Project #2.pdf (page 2 of 4) . This is where you can choose what descriptive statistics to run on our 6 individual groups. Some of these are ready to go (Mean, Number of Cases, and Standard Deviation). Choose "Std. Error of Mean" from the Statistics section, and place it in the "Cell Statistics" section. Then, press "continue". • Press "OK" to run the analysis. • The statistics viewer will open, revealing all of your descriptive statistics for the individual groups! You need this information to complete your report. 4. Perform a Two-factor ANOVA and make a graph. • From the menus at the top of the program, choose Analyze > General Linear Model > Univariate... • In the pop-up box titled "Univariate", choose the Dependent Variable (Activity). Place this in the section labeled "Dependent Variable". • Choose both of your Independent Variables (Sex and Treatment). Place this in the section titled "Fixed Factors". . On the right side of the pop-up box, click Plots.... • In the pop-up box titled "Univariate: Profile Plots", Choose Sex, and place in the section titled "Separate Lines". • Choose Treatment, place it in the section titled "HorizontalAxis". • Press "Add". . In the section titled "Error Bars", check "Include Error Bars". Then, choose "Standard Error" and change the "Multiplier" to 1. I • Press Continue. Press OK • . The statistics viewer will reveal your completed two-factor ANOVA in the section titled "Tests of Between-Subjects Effects"! Look at the rows titled Sex, Treatment, Sex Treatment, and Error. Compare this to the two-factor ANOVA from your class activity. You will need this information to complete your report. . In the section titled "Profile Plots", you will find your line graph. Compare this to the line graph you completed in your two-factor ANOVA class activity. 5. Perform Post-hoc tests to compare Treatment groups within Males • Our goal is to perform post-hoc tests comparing Treatment within Sex. To do this, we will need to run two brand new one-way ANOVAs to compare Treatment within each Sex. . From the menus at the top of the program, choose Data> Select Cases... • Select "If condition is satisfied..." Press "if..." 12 809 W SPSS Project # 2.pdf (page 3 of 4) - • Choose Sex, and press the right arrow to place it in the box. • Next to word Sex, type "=1". • Press Continue. • Press OK. • Now, any statistics you run will only be performed on Males. • From the menus at the top of the program, choose Analyze > General Linear Model > Univariate... • In the pop-up box titled "Univariate", choose the Dependent Variable (Activity). Place this in the section labeled "Dependent Variable". . Choose ONLY THE INDEPENDENT VARIABLE CALLED "Treatment". Place this in the section titled "Fixed Factors". On the right side of the pop-up box, click "Post Hoc..." . • Choose the Independent Variable (Treatment). Place this in the section titled "Post Hoc Tests For". • In the section titled "Equal Variances Assumed", choose "Tukey". • Press Continue • Press OK. . The statistics viewer reveals an ANOVA comparing your three treatment groups, but only within Males. Scroll down to the section titled "Post Hoc Tests". This section shows the Mean differences for every possible comparison between treatment conditions, and precise significance (p)alues for each comparison. You will need these for your final report. 6. Finally, perform Post-hoc tests to compare Treatment within Females. • Repeat everything you did in Step 5, but when you select cases, you will choose "Sex = 2". This will perform the post-hoc tests only in Females. 12 SPSS Project #2.pdf (page 4 of 4) - Final Report: Prepare a brief summary (a paragraph or two) of your findings from this two-factor research study. Your report must include: W • Descriptive statistics (MEAN and STANDARD ERROR) from all 6 of your individual groups. • The results of your two-factor ANOVA-both MAIN EFFECTS and INTERACTIONS. State these in proper research report format and include the precise p-values you found in SPSS. • The line graph you created when performing the two-factor ANOVA in SPSS, with the standard error bars. • The results of your Tukey's post-hoc tests. Specifically, include all of the statistically significant Mean Differences you found from these tests and the precise p-values you found in SPSS. • In a concluding paragraph, summarize your overall final results. How does brain activity in response to cortisol treatment differ between Males and Females? You also need to provide me the complete SPSS output of your tests (Descriptive statistics, ANOVA, post-hoc tests, graphs). NOTE: THIS SPSS PROJECT #2 IS DUE AT 11:59PM ON FRIDAY, 12/13!!! U SPSS Project #2 The goal of this second SPSS project is to learn how to run descriptive statistics, Analysis of Variance (ANOVA), and post-hoc testing for a two-factor study in a statistics program (SPSS). In class, we completed this assignment by hand with a class activity. Now, you will reperform this analysis using SPSS. SPSS Project #2.pdf (page 1 of 4) ✓ Here is a description of the research problem to refresh your memory: A researcher is examining the influence of biological sex and cortisol (a stress hormone) on the functional activity of a brain area called the amygdala that has been linked to aggressive behavior. The researcher randomly assigns his male and female subjects to three treatment groups: one that receives no cortisol (control), one that receives a small dose, and one that receives a large dose. The researcher shows his test subjects an anger-inducing picture while their brain is imaged under an fMRI scanner, and records the percent change in brain activity within the amygdala. Step by Step instructions to complete this assignment: 1. Download the SPSS Project #2 dataset (SPSS .sav file) that has been posted on Canvas. You do not need to enter any new data for this assignment! Open this file in SPSS. 2. Compare this data to your Two-Factor ANOVA in-class activity. Notice that for the independent variable "Sex", each subject has been coded with either a 1 (Male) or 2 (Female). For the independent variable "Treatment", each subject has been coded with either a 0 (Control), 1 (Small Dose), or 2 (Large Dose). 3. Perform Descriptive Statistics: mock. From the menus at the top of the program, choose Analyze > Compare Means > Means... • In the pop-up box titled "Means", choose the Dependent Variable (Activity). Place this in the section labeled "Dependent List". • Choose the first Independent Variable (Sex). Place this in the section labeled "Layer 1 of 1". . In the section titled "Layer 1 of 1", click Next. Choose the second Independent Variable (Treatment). Place this in the section labeled "Layer 2 of 2". . On the right side of the pop-up box, click Options... . Help W SPSS Project #2.pdf (page 2 of 4) . This is where you can choose what descriptive statistics to run on our 6 individual groups. Some of these are ready to go (Mean, Number of Cases, and Standard Deviation). Choose "Std. Error of Mean" from the Statistics section, and place it in the "Cell Statistics" section. Then, press "continue". • Press "OK" to run the analysis. • The statistics viewer will open, revealing all of your descriptive statistics for the individual groups! You need this information to complete your report. 4. Perform a Two-factor ANOVA and make a graph. • From the menus at the top of the program, choose Analyze > General Linear Model > Univariate... • In the pop-up box titled "Univariate", choose the Dependent Variable (Activity). Place this in the section labeled "Dependent Variable". • Choose both of your Independent Variables (Sex and Treatment). Place this in the section titled "Fixed Factors". . On the right side of the pop-up box, click Plots.... • In the pop-up box titled "Univariate: Profile Plots", Choose Sex, and place in the section titled "Separate Lines". • Choose Treatment, place it in the section titled "HorizontalAxis". • Press "Add". . In the section titled "Error Bars", check "Include Error Bars". Then, choose "Standard Error" and change the "Multiplier" to 1. I • Press Continue. Press OK • . The statistics viewer will reveal your completed two-factor ANOVA in the section titled "Tests of Between-Subjects Effects"! Look at the rows titled Sex, Treatment, Sex Treatment, and Error. Compare this to the two-factor ANOVA from your class activity. You will need this information to complete your report. . In the section titled "Profile Plots", you will find your line graph. Compare this to the line graph you completed in your two-factor ANOVA class activity. 5. Perform Post-hoc tests to compare Treatment groups within Males • Our goal is to perform post-hoc tests comparing Treatment within Sex. To do this, we will need to run two brand new one-way ANOVAs to compare Treatment within each Sex. . From the menus at the top of the program, choose Data> Select Cases... • Select "If condition is satisfied..." Press "if..." 12 809 W SPSS Project # 2.pdf (page 3 of 4) - • Choose Sex, and press the right arrow to place it in the box. • Next to word Sex, type "=1". • Press Continue. • Press OK. • Now, any statistics you run will only be performed on Males. • From the menus at the top of the program, choose Analyze > General Linear Model > Univariate... • In the pop-up box titled "Univariate", choose the Dependent Variable (Activity). Place this in the section labeled "Dependent Variable". . Choose ONLY THE INDEPENDENT VARIABLE CALLED "Treatment". Place this in the section titled "Fixed Factors". On the right side of the pop-up box, click "Post Hoc..." . • Choose the Independent Variable (Treatment). Place this in the section titled "Post Hoc Tests For". • In the section titled "Equal Variances Assumed", choose "Tukey". • Press Continue • Press OK. . The statistics viewer reveals an ANOVA comparing your three treatment groups, but only within Males. Scroll down to the section titled "Post Hoc Tests". This section shows the Mean differences for every possible comparison between treatment conditions, and precise significance (p)alues for each comparison. You will need these for your final report. 6. Finally, perform Post-hoc tests to compare Treatment within Females. • Repeat everything you did in Step 5, but when you select cases, you will choose "Sex = 2". This will perform the post-hoc tests only in Females. 12 SPSS Project #2.pdf (page 4 of 4) - Final Report: Prepare a brief summary (a paragraph or two) of your findings from this two-factor research study. Your report must include: W • Descriptive statistics (MEAN and STANDARD ERROR) from all 6 of your individual groups. • The results of your two-factor ANOVA-both MAIN EFFECTS and INTERACTIONS. State these in proper research report format and include the precise p-values you found in SPSS. • The line graph you created when performing the two-factor ANOVA in SPSS, with the standard error bars. • The results of your Tukey's post-hoc tests. Specifically, include all of the statistically significant Mean Differences you found from these tests and the precise p-values you found in SPSS. • In a concluding paragraph, summarize your overall final results. How does brain activity in response to cortisol treatment differ between Males and Females? You also need to provide me the complete SPSS output of your tests (Descriptive statistics, ANOVA, post-hoc tests, graphs). NOTE: THIS SPSS PROJECT #2 IS DUE AT 11:59PM ON FRIDAY, 12/13!!! U
Expert Answer:
Answer rating: 100% (QA)
The question seems to be incomplete as it looks like the images are providing stepbystep instruction... View the full answer

Related Book For 

Statistical Techniques in Business and Economics
ISBN: 978-1259666360
17th edition
Authors: Douglas A. Lind, William G Marchal
Posted Date:
Students also viewed these accounting questions
-
The purpose of this exercise is to learn how to calculate stock returns for portfolio models using actual stock price data. Ten years worth of stock price data are included in the file StockReturns...
-
A goal of financial literacy for children is to learn how to manage money wisely. One question is: How much money do children have to manage? A recent study by Schnur Educational Research Associates...
-
The purpose of this exercise is to learn how to calculate stock returns for portfolio models using actual stock price data. First, it is necessary to obtain stock price data. One source (of many) is...
-
Assume a portfolio of two assets, with $10m invested in asset 1 and $5m invested in asset 2. The per pound covariance matrix of the two assets is: Asset 1 Asset 2 The best hedge of asset 2 is: Asset...
-
What advantages do sales of loans have for lending institutions trying to raise funds?
-
Discuss the stability of each of these species based on the octet rule and formal charges; . b) H- a) e) -N d) H- -N-C e)
-
Assume the same information as in question 4. Also assume that beginning work in process had \($6,000\) in conversion cost and that \($84,000\) in conversion is added during this period. What is the...
-
On January 1, 2012, Crume Incorporated issued bonds with a face value of $100,000, a stated rate of interest of 9 percent, and a five-year term to maturity. Interest is payable in cash on December 31...
-
e3z (i) Find all the poles of the function f (z) = and plot them on 22(22 +22+2) (ii) an Argand diagram. Hence evaluate the integral of (2) dz, writing your solutions in the form a + jb where a and b...
-
Tony Anderson Productions is a sole trader-ship. On December 31, 2010 the following Trial Balance was extracted from the business's books: Trial Balance as at December 31, 2010 Details Return inwards...
-
1. To begin, assume that it is now January 1, 1993, and that each bond in Table 1 matures on December 31 of the indicated year. Also, suppose each bond has a par value of $1,000, each it had a...
-
The Rhodes Food Group (RFG), issued the following statement on dividends recently. "Dividend Policy: The Directors recognise the importance of maintaining a consistent and transparent dividend policy...
-
Formulate your personal goals and objectives and develop a plan for achieving those goals. The plan should include specific actions, timelines, and resources required to achieve each goal. Use the...
-
Company x is required to restate its financial statements. based on one study, what is typically the market's reaction to the restatement: A. market may penalize the stock price for a three-day...
-
Company Capsi realized in the financial year 20X6 a profit of 600,000 which is attributable to the ordinary shareholders. In the year 20X6 300,000 shares are outstanding. The BEPS for company Capsi...
-
1. A digital image has 600 PPI (pixel per inch) with 16-bit grayscale level. The dimension of the image is 4 inch x 6 inch. How many images can be store in a storage device having a capacity of 2 GiB...
-
On January 2, 2022, Coral Enterprises purchased 90% of Hunt Incorporated outstanding common stock for $1,687,500 cash. Hunts net assets had a book value of $1,300,000 at the time. A building with a...
-
Beginning with a country that has a trade deficit, demonstrate graphically what will happen to a countrys potential output with globalization if that countrys costs of production fall. Explain your...
-
An investor purchased 200 shares of the Blair Company for $36 each in July of 2013, 300 shares at $40 each in September 2015, and 500 shares at $50 each in January 2016. What is the investors...
-
A goal of financial literacy for children is to learn how to manage money wisely. One question is: How much money do children have to manage? A recent study by Schnur Educational Research Associates...
-
Refer to the following table. a. Determine P(A 1 ). b. Determine P(B 1 | A 2 ). c. Determine P(B 2 and A 3 ). Flrst Event Second Event A, A, 3 Total A, B, 2 B2 Total 3 4 10 3
-
Consider the unitary operator \(e^{i \hat{A}}\), with \(\hat{A}\) Hermitian and acting on function space. Can it be diagonalized? If so, write an expression for its diagonal elements.
-
Is a real function of a Hermitian operator \(\hat{A}, f(\hat{A})\), also Hermitian? Give examples.
-
Is the square of the "delta function" a distribution? If so, prove it using Dirac's bra-ket notation.

Study smarter with the SolutionInn App