

Question: SPY Your Current Portfolio BA Your Portfolio after adding BA to it Summary Statistics Average 0.70% 1415 1.04% 0.0022 1.09% 0.0020 Variance 0.0038 0.0014 3.71%
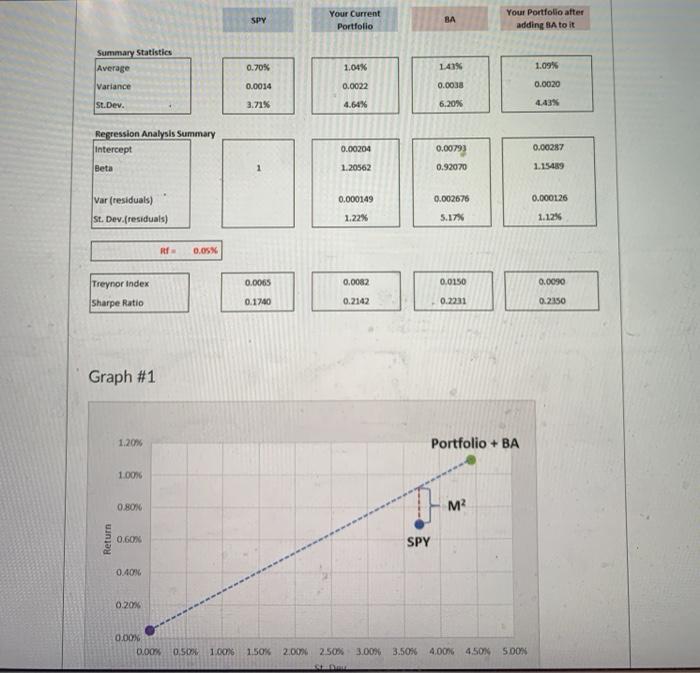
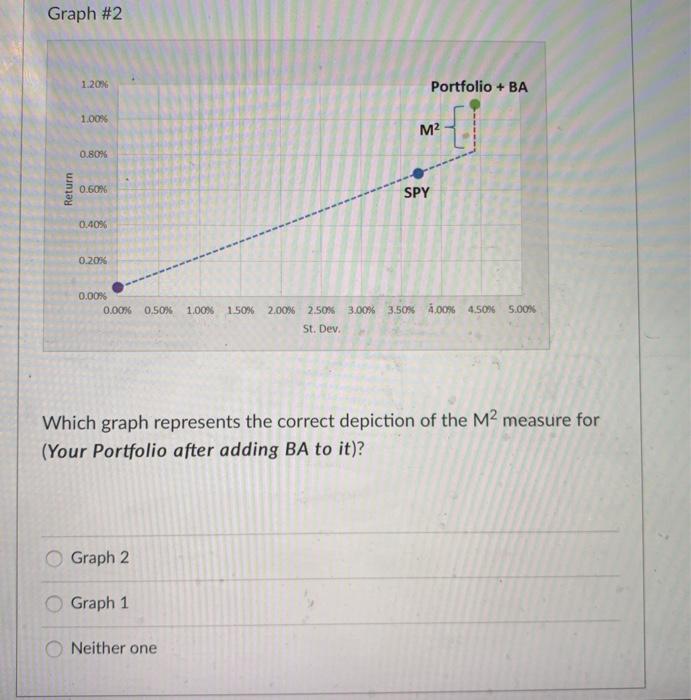
SPY Your Current Portfolio BA Your Portfolio after adding BA to it Summary Statistics Average 0.70% 1415 1.04% 0.0022 1.09% 0.0020 Variance 0.0038 0.0014 3.71% St.Dev. 4.64% 6,20% 4.43% Regression Analysis Summary Intercept 0.00204 0.00287 0.0079) 0.92070 Beta 1.20562 1.15489 0.000149 0.002676 0.000126 Var (residuals) St. Dev.(residuals) 1.22% 5.17% 1.1216 0.05X 0.0065 0.0082 0.0150 0.0090 Treynor Index Sharpe Ratio 0.1740 0.2142 0.2231 0.2350 Graph #1 1.2014 Portfolio + BA 1.00 0.80 MP Return 0.60 SPY 0.40% 0.2014 0.00% 0.00 0,50 1.00 150% 2.00% 25% 3.00% 3.50% 4,00% 4.50N SOON Graph #2 1.20% Portfolio + BA 1.00% M2 { 0.80% Return 0.60% SPY 0.40% 0.20% 0.00% 0.00% 0.50% 1.00% 1.50% 2.00% 2.50% 3.00% 3.50% 2.00% 4.50% 5.00% St. Dev. Which graph represents the correct depiction of the M2 measure for (Your Portfolio after adding BA to it)? Graph 2 Graph 1 Neither one
Step by Step Solution
There are 3 Steps involved in it

Get step-by-step solutions from verified subject matter experts