

Question: SQL Question: How would I plot a certain time frame or the last 24 hours? Here's what I have so far I just need to
SQL Question: How would I plot a certain time frame or the last 24 hours? Here's what I have so far I just need to query the date correctly.
SQL Code:
select [DateandTime], [HeatId], [KWH], (Gas1_ACT_BUR_CUM + Gas2_ACT_BUR_CUM+Gas3_ACT_BUR_CUM) as Total_Gas_SCFM
From Meltshop.dbo.EafBurnersSummary where(
[KWH]=0 )
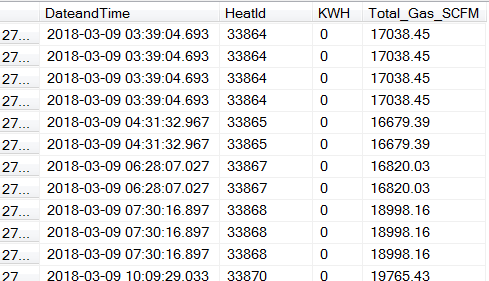
How it looks in the database so far:
Thanks.
DateandTime Heatld 27... 2018-03-09 03:39:04.693 33864 27... 2018-03-09 03:39:04.693 33864 27... 2018-03-09 03:39:04.693 33864 27... 2018-03-09 03:39:04.693 33864 27... 2018-03-09 04:31:32.967 33865 27 2018-03-09 04:31:32.967 33865 27... 2018-03-09 06:28:07.027 33867 27... 2018-03-09 06:28:07.027 33867 27... 2018-03-09 07:30:16.897 33868 27... 2018-03-09 07:30:16.897 33868 27... 2018-03-09 07:30:16.897 33868 2018-03-09 10:09:29.033 33870 KWH Total_Gas_SCFM 17038.45 17038.45 17038.45 17038.45 16679.39 16679.39 16820.03 16820.03 18998.16 18998.16 18998.16 19765.43 27
Step by Step Solution
There are 3 Steps involved in it

Get step-by-step solutions from verified subject matter experts