

Question: SS 9.10. Consider the minute clinic waiting time data in Exercise 6.41. These data may not be normally distributed. Set up an EWMA control chart
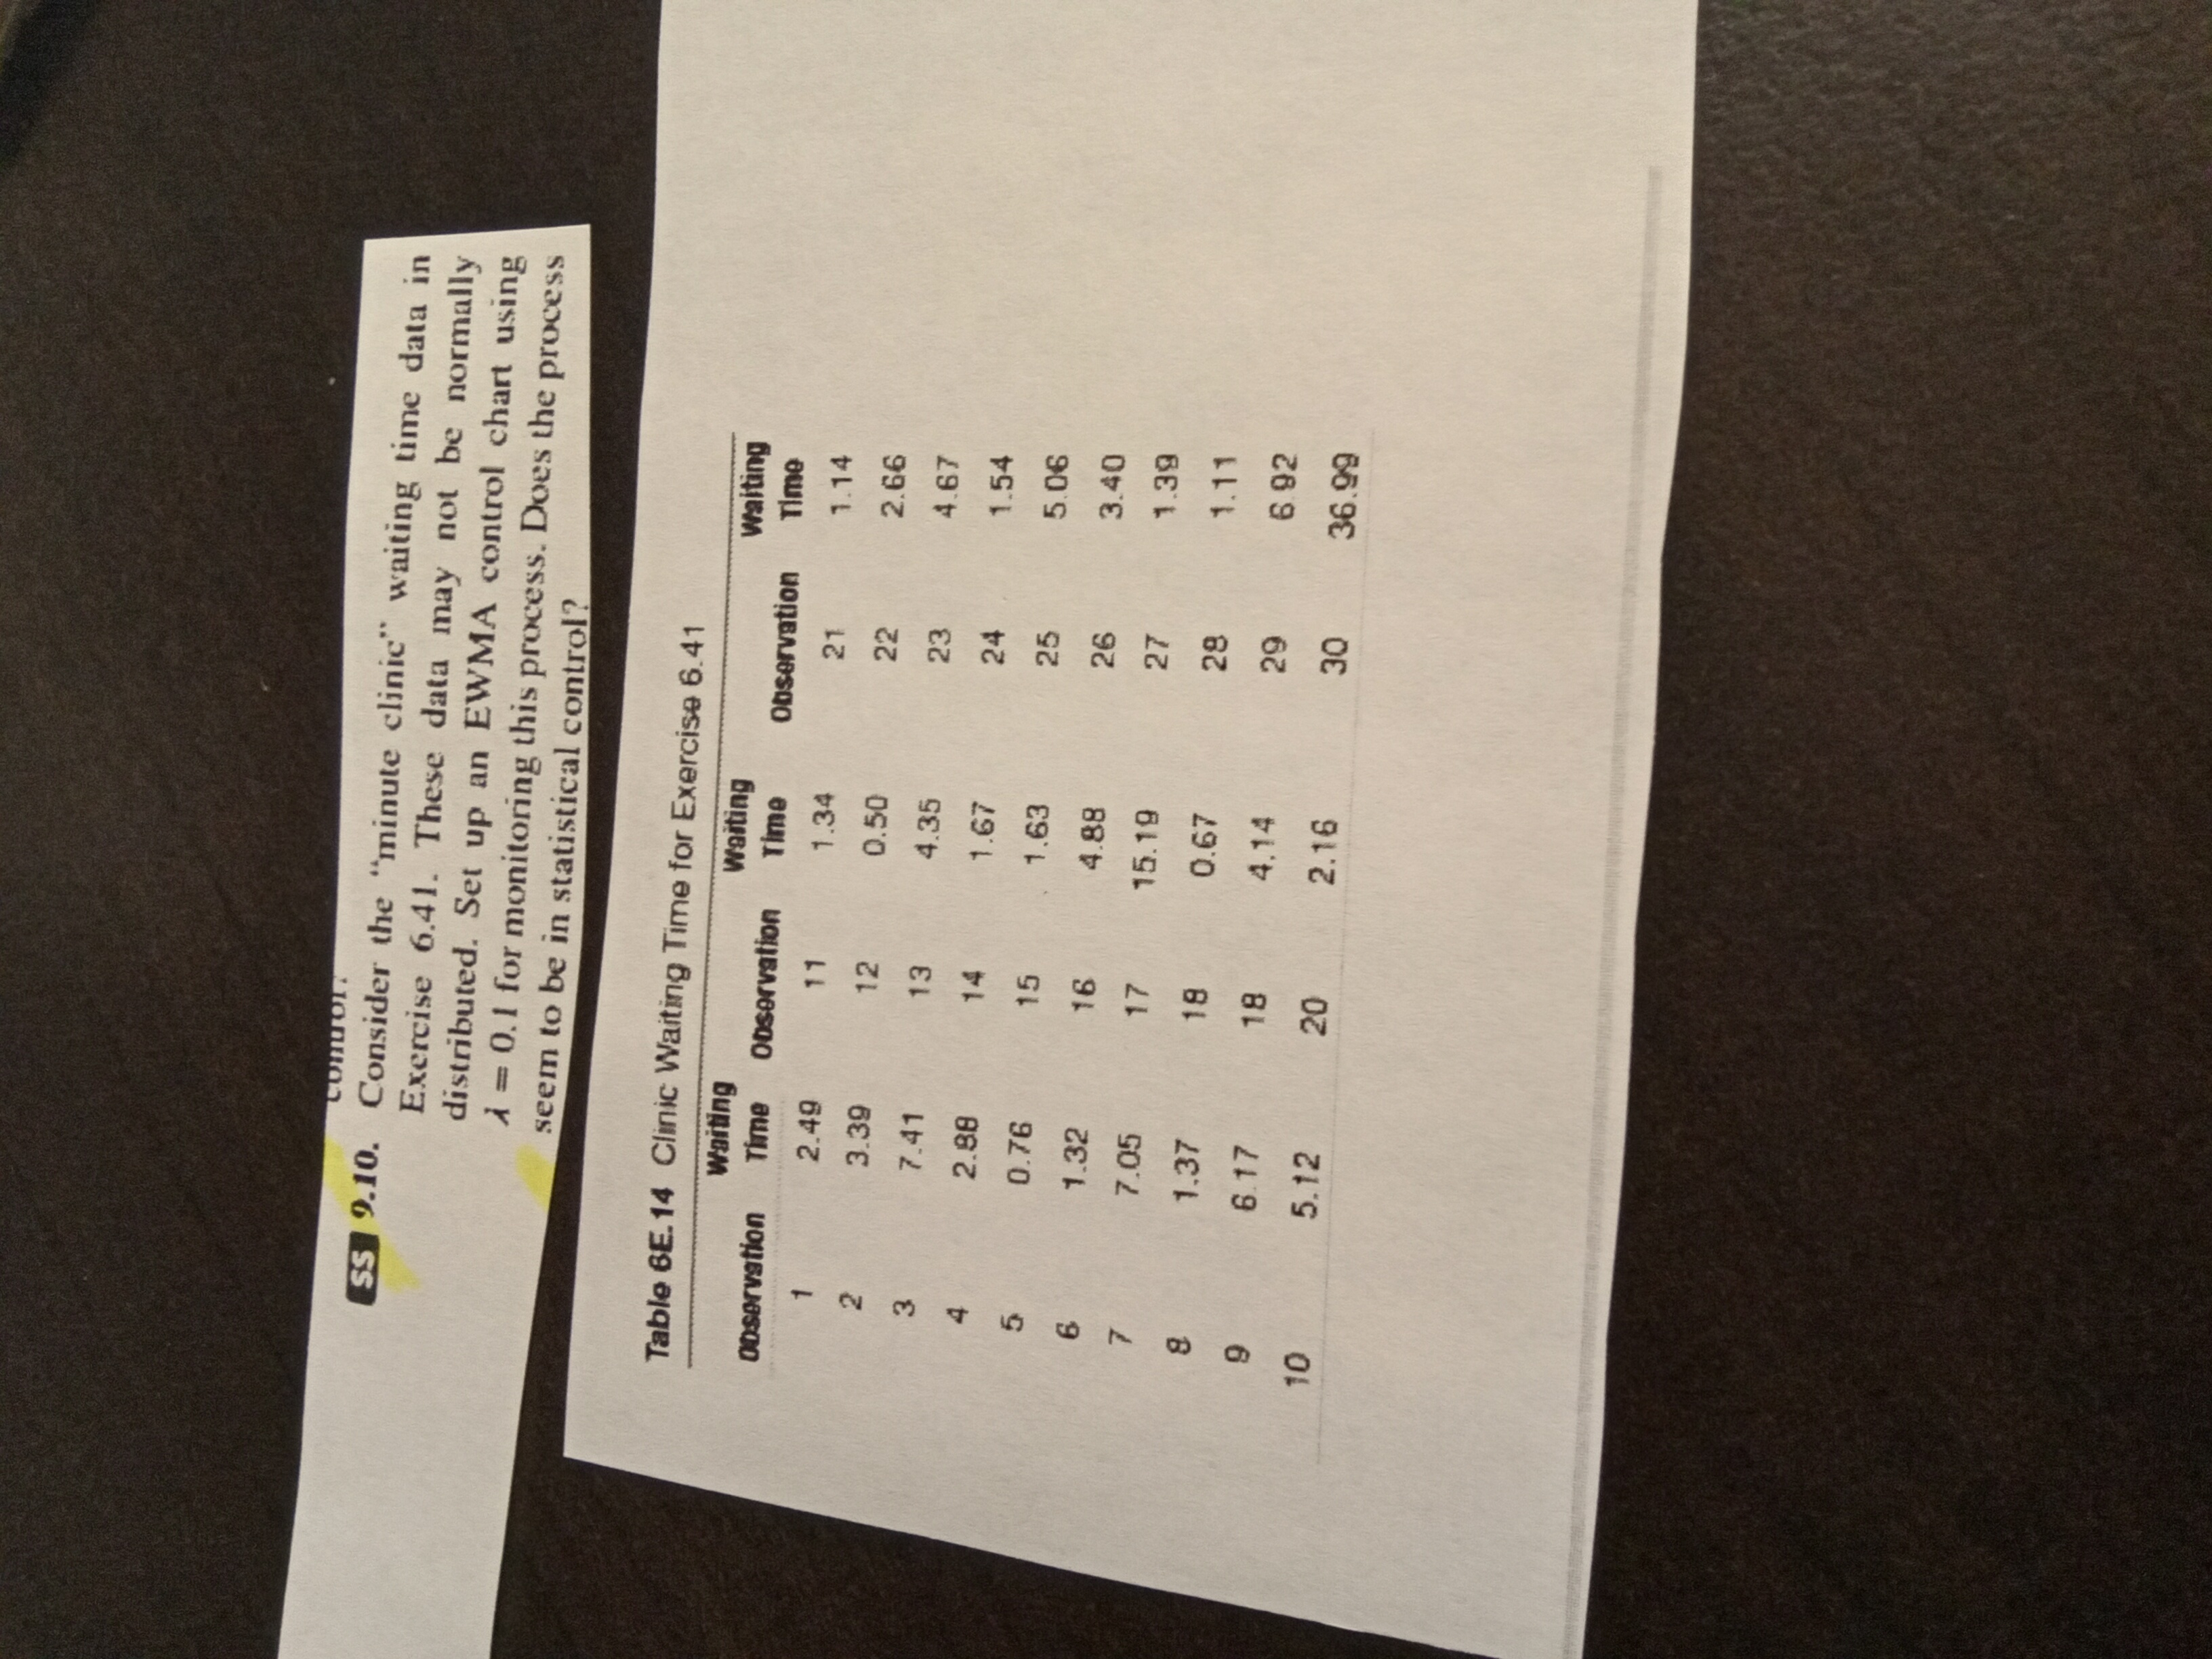
SS 9.10. Consider the "minute clinic" waiting time data in Exercise 6.41. These data may not be normally distributed. Set up an EWMA control chart using A = 0.1 for monitoring this process. Does the process seem to be in statistical control? Table BE. 14 Clinic Waiting Time for Exercise 6.41 Waiting Waiting waiting observation Time Observation Time Observation Time 1 2.49 17 1.34 21 1.14 2 3.39 12 0.50 22 2.66 3 7.41 13 4.35 23 4.67 4 2.88 14 1.67 24 1.54 5 0.76 15 1.63 25 5.06 1.32 16 4.88 26 3.40 7.05 17 15.19 27 1.39 8 1.37 18 0.67 28 1.11 9 6.17 18 4.14 29 6 92 10 5.12 20 2.16 30 36.99
Step by Step Solution
There are 3 Steps involved in it
1 Expert Approved Answer
Step: 1 Unlock

Question Has Been Solved by an Expert!
Get step-by-step solutions from verified subject matter experts
Step: 2 Unlock
Step: 3 Unlock