

Question: SS Activity 3 AF . xIsx Histo Aid Data File 1 Data File 2 Dist 1 Dist 2 Dist Pics table [ [ ]
SS Activity AFxIsx
Histo Aid
Data File
Data File
Dist
Dist
Dist Pics
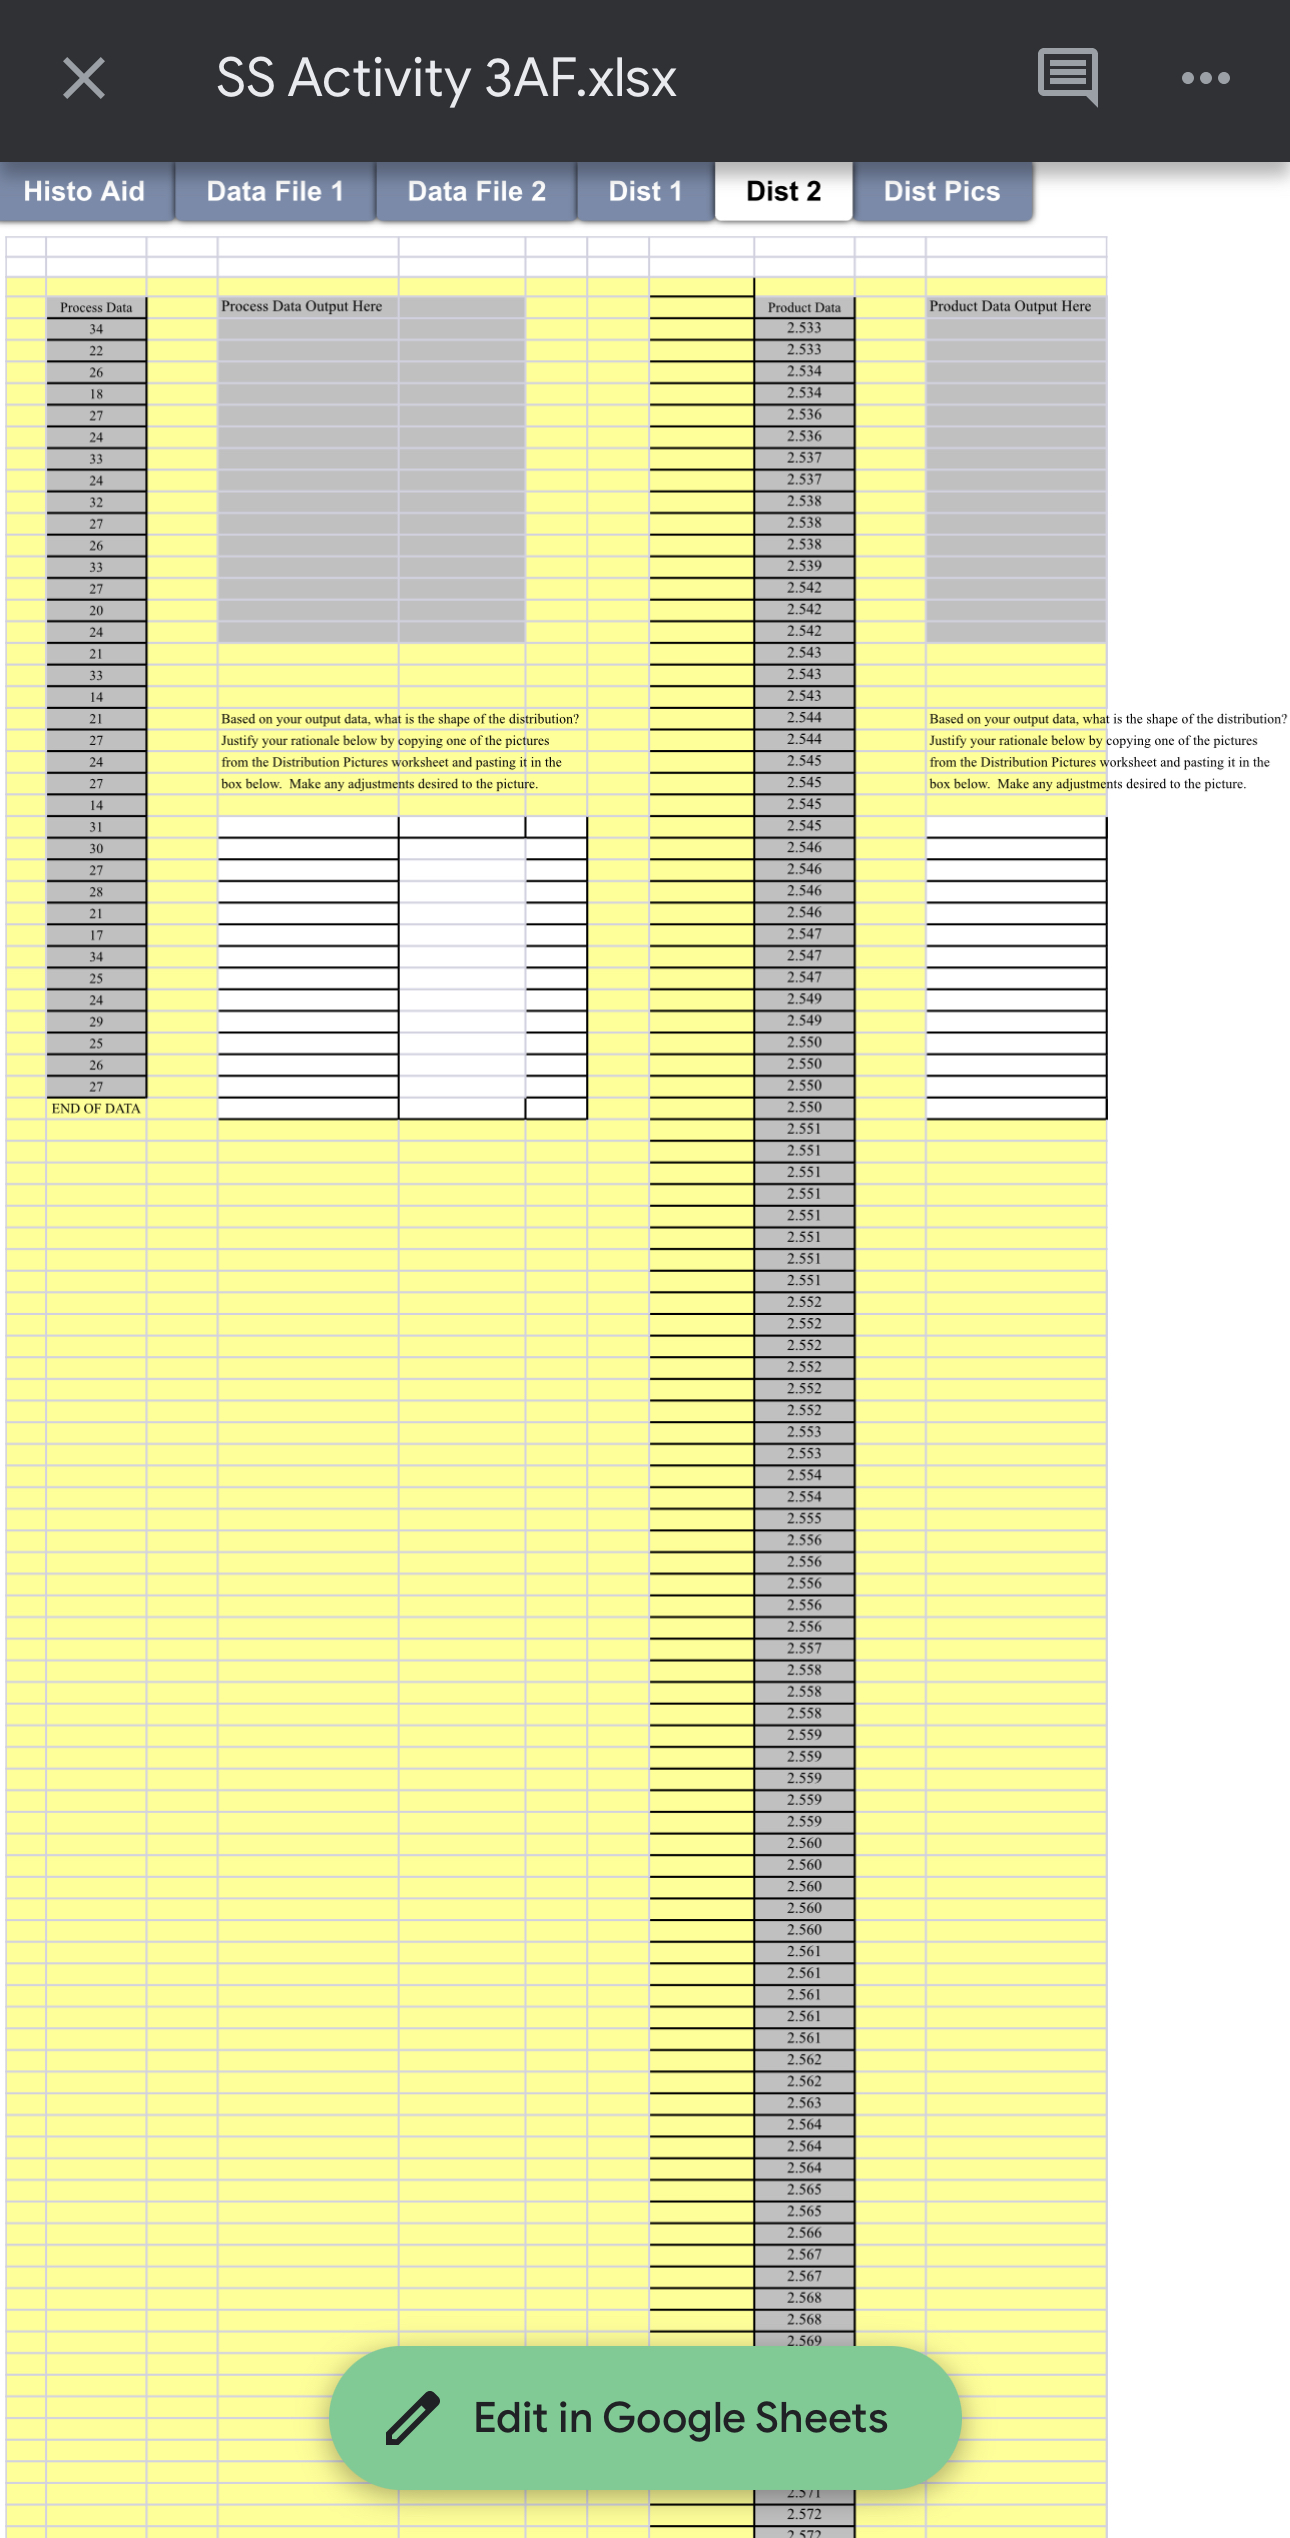
tableProcess DataEND OF DATA
Product Data Output Here
Based on your output data, what is the shape of the distribution? Justify your rationale below by copying one of the pictures from the Distribution Pictures worksheet and pasting it in the box below. Make any adjustments desired to the picture.
table
Step by Step Solution
There are 3 Steps involved in it
1 Expert Approved Answer
Step: 1 Unlock

Question Has Been Solved by an Expert!
Get step-by-step solutions from verified subject matter experts
Step: 2 Unlock
Step: 3 Unlock