

Question: ssion ment open Assignment MESSAGE MY INSTRUCTOR Comparative statement data for Farris Company and Ratzlaff Company, two competitors, appear below. balance sheet data are as
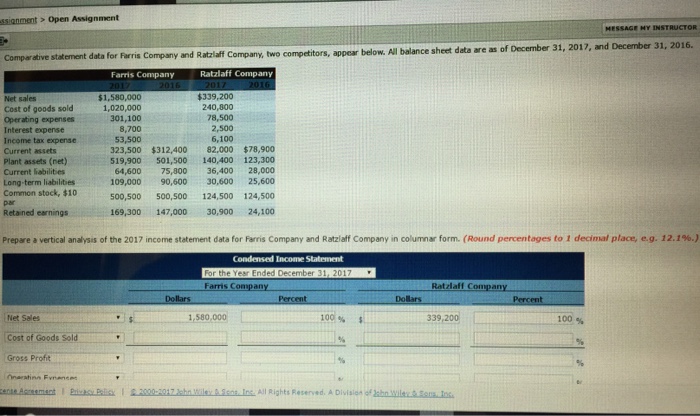
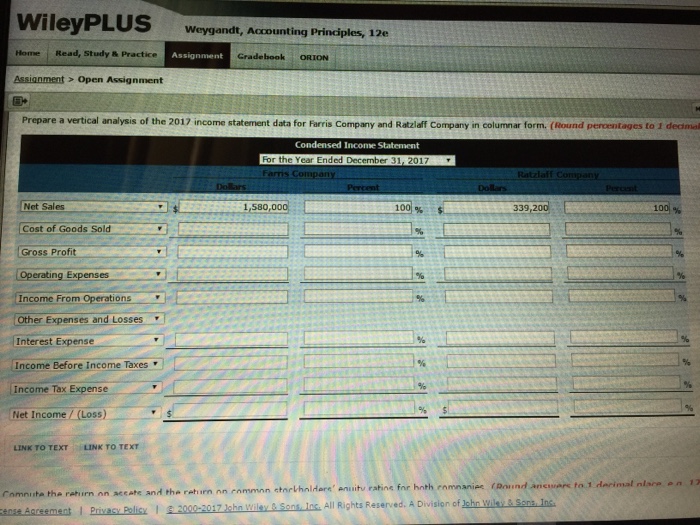
ssion ment open Assignment MESSAGE MY INSTRUCTOR Comparative statement data for Farris Company and Ratzlaff Company, two competitors, appear below. balance sheet data are as of December 31, 2017, and December 31, 2016. Al Ratzlaff Company Farris Company $1,580,000 $339,200 Net sales 240,800 Cost of goods sold 1,020,000 78,500 301,100 operating expenses 8,700 6,100 323,500 $312,400 82,000 $78,900 140,400 123,300 Plant assets (net) 5191900 501,500 Current liabilities 64,600 75,800 36,400 28,000 109,000 90,600 30,600 25.600 Long-term liabilities Common stock, $10 500,500 500,500 124,500 124,500 1691300 147,000 30,900 24,100 Retained earnings Prepare a vertical analysis of the 2017 income statement data for Farris Company and Ratzlaff company in columnar form. (Round percentages to 1 decimal place, e.g. 12.1%.) Condensed Income Statement e Year Ended December 2017 Farris Con Ratzlaff Company Dollars 1 580,000 100 Net Sales 100 Gross Profit Rights R A Division of
Step by Step Solution
There are 3 Steps involved in it

Get step-by-step solutions from verified subject matter experts